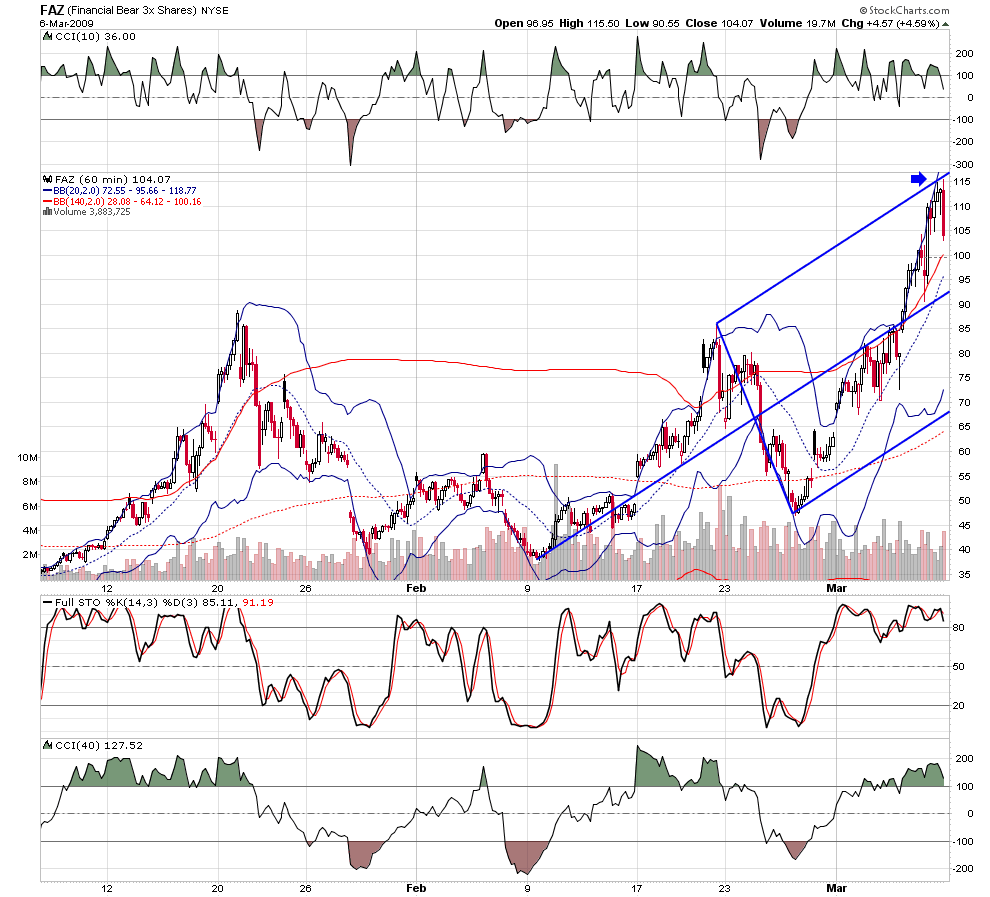
why 666 ?
Besides it being the numbers carved into my scalp does anyone know why that was the stopping price....this week? I heard a known vendor call that number on Tuesday morning.......a rare good call....
was that a longer term fib?
Bruce
was that a longer term fib?
Bruce
Natural numbers...exactly 2/3's of 1000 other natural HUB's is 1/4s and 1/8s. Some call them gann numbers since he made them famous in "How to make Profits in Commodities" pg 34.
I don't know but I did hear the same call. However, on my chart I did haved 666.75 marked.
This is how I came to that #. Using the measured move from the DVA after we close below it.
RTH VAH 694.75 - VAL 680.75 = 14. VAL 680.75 - 14 = 666.75. The rest as they say is history.
This is how I came to that #. Using the measured move from the DVA after we close below it.
RTH VAH 694.75 - VAL 680.75 = 14. VAL 680.75 - 14 = 666.75. The rest as they say is history.
thanks Red and Joe!!
quote:
Originally posted by BruceM
Besides it being the numbers carved into my scalp does anyone know why that was the stopping price....this week? I heard a known vendor call that number on Tuesday morning.......a rare good call....
was that a longer term fib?
Bruce
...Courtesy of Francis Bussiere
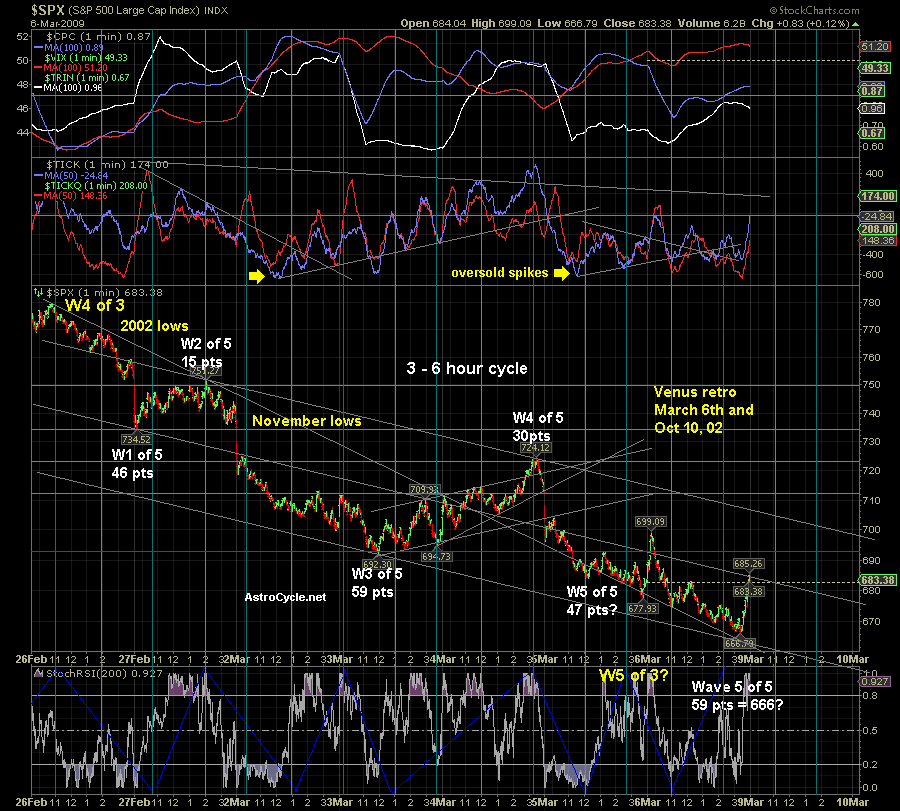
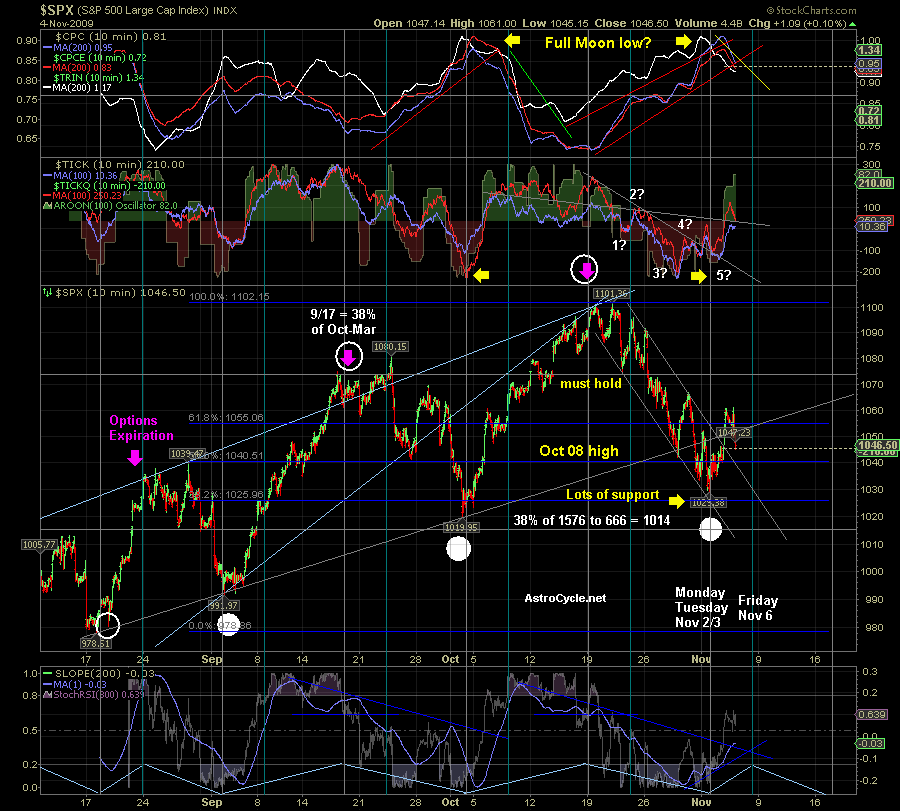
As you can see, it was from shorter term wave relationships, not longer term fib clusters.Wave 5=wave3 at 666. From what i can gather most wave theorists are looking for the 650 area. And in fact ,i have an outstanding price projection from the hourly chart to 654.75, good unless 699.25 is touched again. Since shorter term projections kept saying 666.50, i had a standing order to buy there most of friday.Several of us in the room were able to take advantage of it! Below is the chart first posted in my room wed. morning in response to a question about the effect(if any!) of moons on trading.
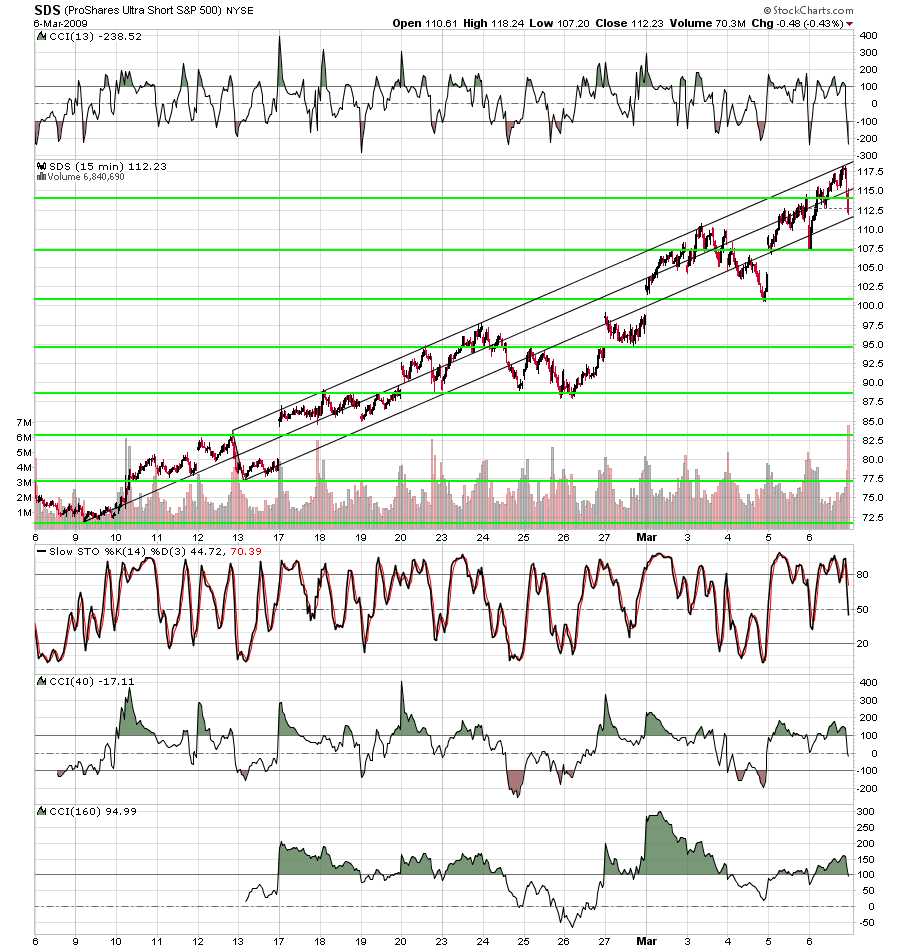
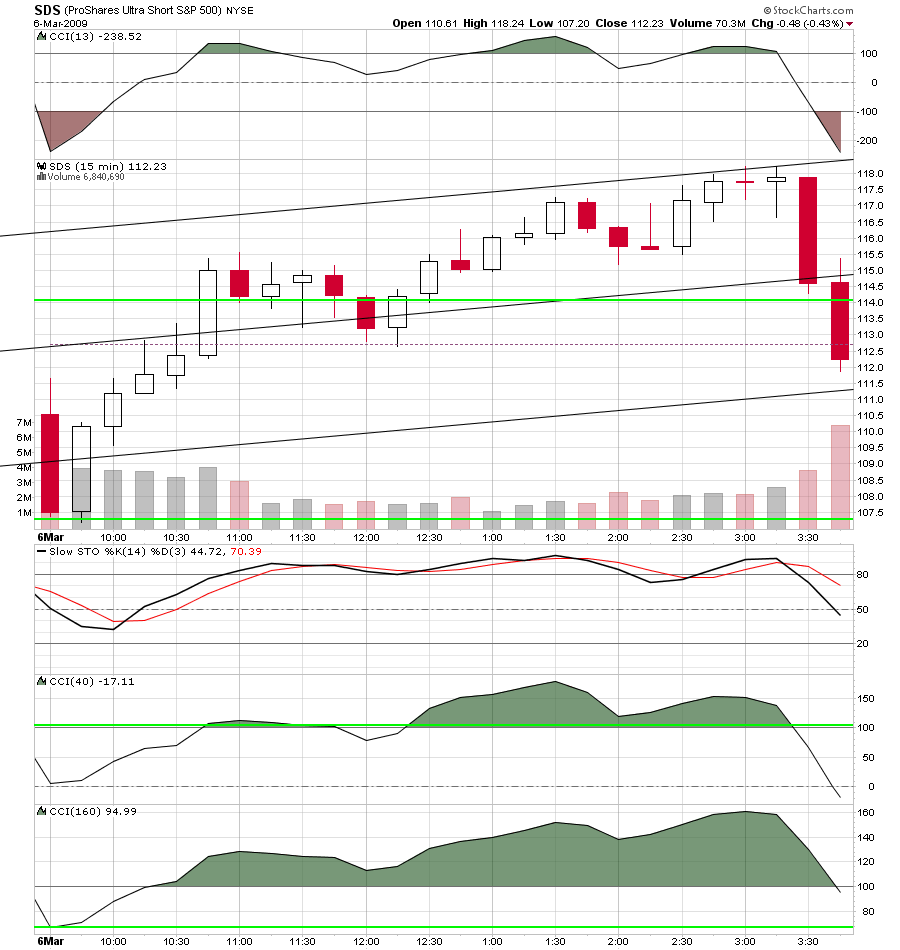
another view-one group of numbers traders i track in the market are the gann traders.. i do not judge their technique.. i simply want to know when they think their work is running the table and they are pressing it aggressively.the past month they have been keying on the 180degrees swings on the sq9( green lines) and if they have aggressively sold between the lines, it has been at the angle generated by the medianline set anchored on the beginning of move.did they hit those levels aggressive once again on friday? yes. charts
Darn, I had predicted the world would end when the ES touched 666. So much for that.
again, i have little interest in forcasts. i am constantly looking for the moments in time when skilled numbers traders who risk their own money and not others are looking to trade.it does not matter what i think of medianline traders. i simply want to know the exact moment when they are looking to dump their positions and reverse.when the gann traders and the medianline traders look to act at the same moment in time... i am grateful to see a trade signal on my charts.chart
speaking of square of 9...Tuesday 3/3/09 was a sauare day. Monday 3/9/09 will be another...lol
666; now today Friday 13th...
Emini Day Trading /
Daily Notes /
Forecast /
Economic Events /
Search /
Terms and Conditions /
Disclaimer /
Books /
Online Books /
Site Map /
Contact /
Privacy Policy /
Links /
About /
Day Trading Forum /
Investment Calculators /
Pivot Point Calculator /
Market Profile Generator /
Fibonacci Calculator /
Mailing List /
Advertise Here /
Articles /
Financial Terms /
Brokers /
Software /
Holidays /
Stock Split Calendar /
Mortgage Calculator /
Donate
Copyright © 2004-2023, MyPivots. All rights reserved.
Copyright © 2004-2023, MyPivots. All rights reserved.
