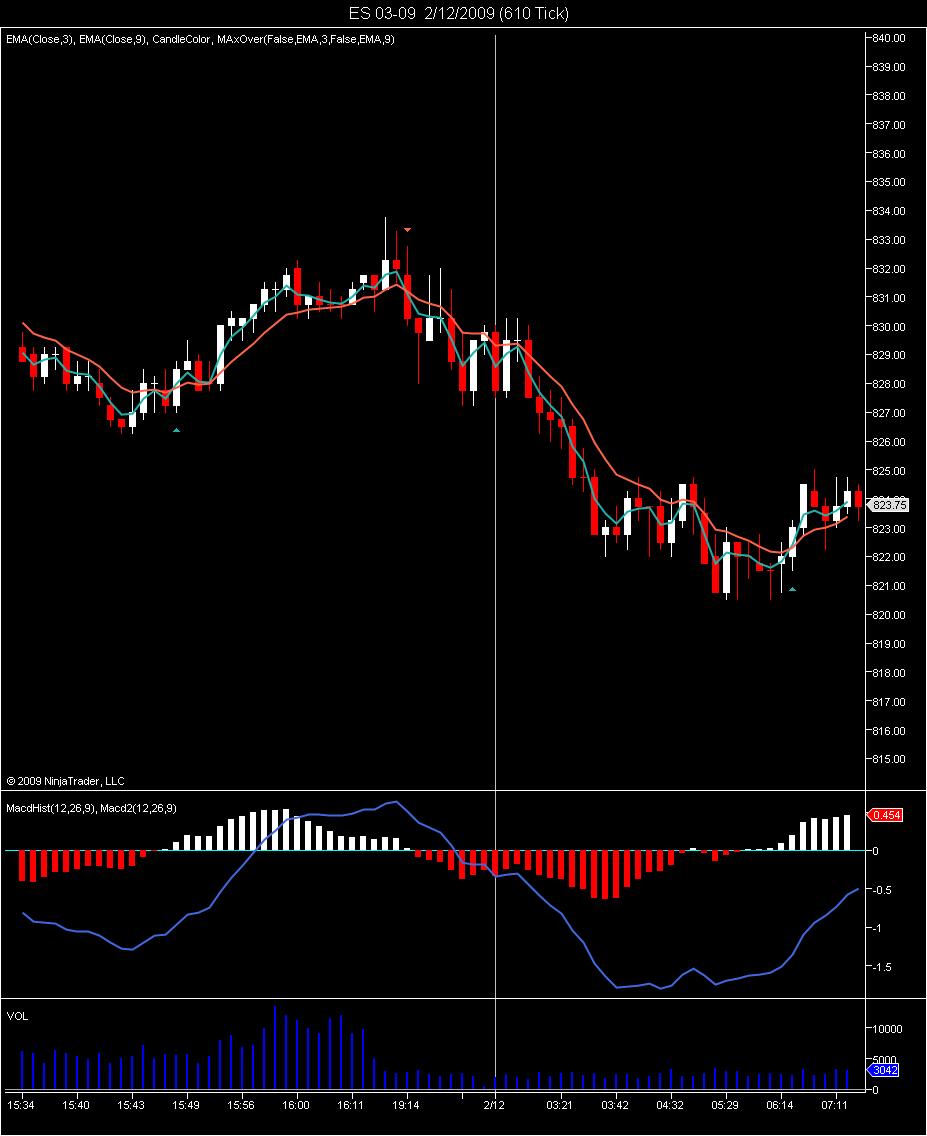
EMA 3 and EMA 9 crossover method
This is for Robin.
ema 3 is blue
ema 9 is red
Long:
ema 3 crosses above ema 9
MACD points up trend
wait for bullish candle for extra confirmation
Short:
ema 3 crosses below ema 9
MAC points down trend
wait for bearish candle for extra confirmation
ema 3 is blue
ema 9 is red
Long:
ema 3 crosses above ema 9
MACD points up trend
wait for bullish candle for extra confirmation
Short:
ema 3 crosses below ema 9
MAC points down trend
wait for bearish candle for extra confirmation
Thanks for sharing. Seams like an easy setup to follow. Have you had good success with it? Do you use it everyday. Any time frame?
You can use a 610T to filter the noise but you can also use on a 233T. 1 min chart is very erratic and difficult to read and make a decision to enter.
I was using this on a 1 min chart and by accident used it on the 610T chart and my eyes were opened.
I was using this on a 1 min chart and by accident used it on the 610T chart and my eyes were opened.
Emini Day Trading /
Daily Notes /
Forecast /
Economic Events /
Search /
Terms and Conditions /
Disclaimer /
Books /
Online Books /
Site Map /
Contact /
Privacy Policy /
Links /
About /
Day Trading Forum /
Investment Calculators /
Pivot Point Calculator /
Market Profile Generator /
Fibonacci Calculator /
Mailing List /
Advertise Here /
Articles /
Financial Terms /
Brokers /
Software /
Holidays /
Stock Split Calendar /
Mortgage Calculator /
Donate
Copyright © 2004-2023, MyPivots. All rights reserved.
Copyright © 2004-2023, MyPivots. All rights reserved.
