ES 1-16-09
I mentioned in the chat room that I'm good friends with Larry Pesavento. In fact, I type his newsletter as he hates to type! :):) I asked him today if he would be ok with me passing along his weekly newsletter as well as interesting charts to which he said was fine. I don't know if there's any interest for this but i'll post this one and let me know if you'd like me to continue. I don't know how to post charts in the forum yet but will search to find out how. Would like to give back if I can as within only 3 days I'm very impressed with the sharing here and the quality of traders. Thanks!!
Larry Pesavento's TradingTutor Newsletter
Stock Indices
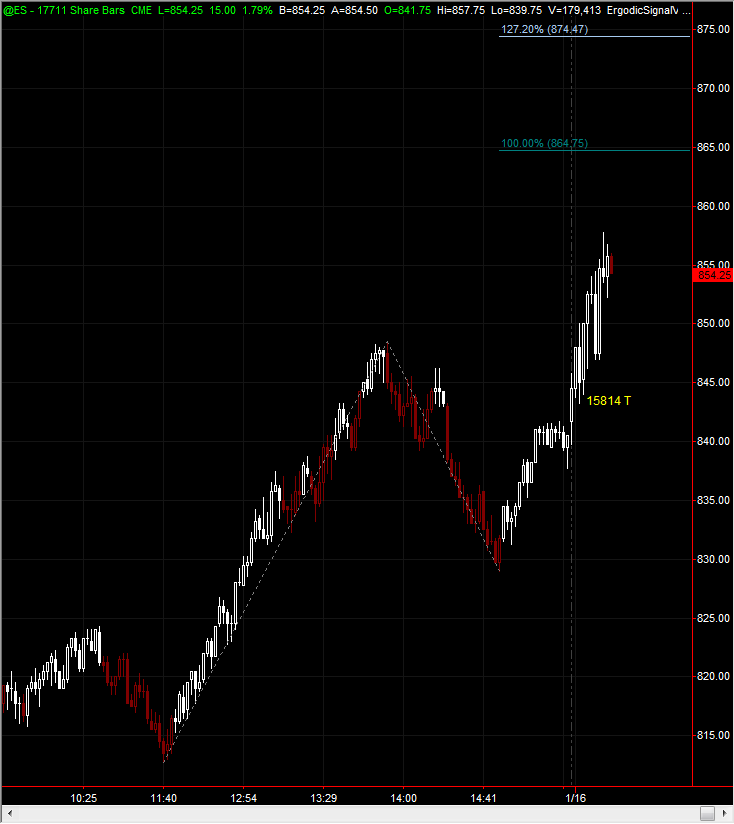
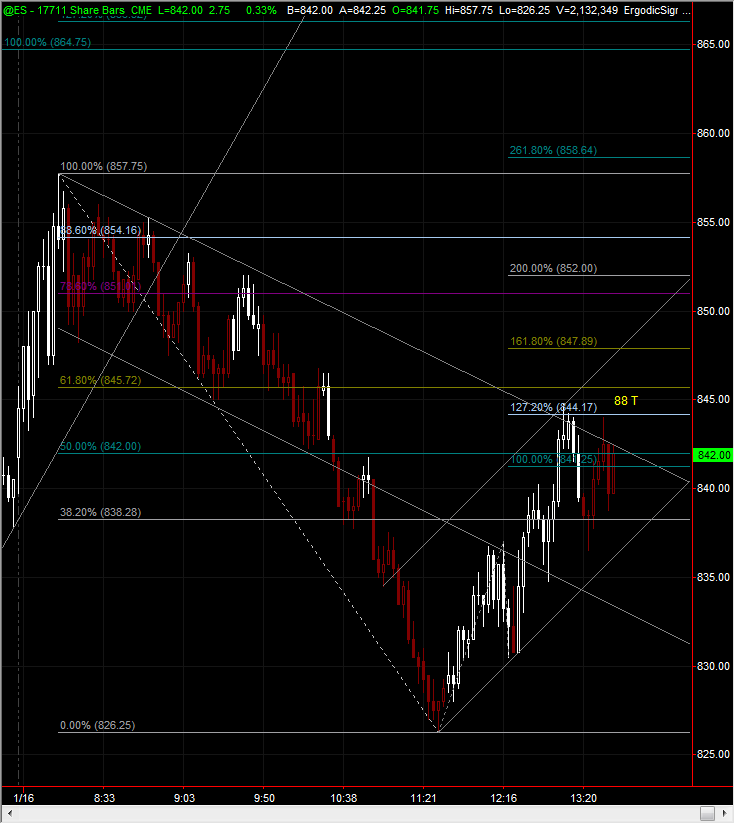
Financial stocks continue to be the albatross around the stock markets neck. There is a head and shoulders pattern occurring in the cash S&P 500. It is also present in the NASDAQ and Dow Jones Industrials. The interesting point this week was that the . 618 retracement in the cash S&P was to the exact spot from the November low to the current low. The VIX index had a nice bounce off the 39.00 level and stopped just shy of the . 618 retracement. This sets up a buy situation following the head and shoulders pattern.
Combust (Mercury conjunct Sun) occurs on Tuesday, January 20th and is followed on Friday, January 23rd by these following aspects.
1. Mars sextile Uranus
2. Venus conjunt Uranus
3. Sun conjunt Jupiter
4. Mars trine Saturn
5. Venus sextile Mars.
In the past, a combination like this has been quite bullish for stocks so my expectation is that the market will be pulled up into Friday of next week. If the market is really strong next week the momentum could carry into mid February.
Quiado "Danger" Should the market gap down on Tuesday, January 20th and we go below the Wednesday low, 812 S&P500 we would be looking at a really negative week in my opinion. The odds of this occurring are less than 15%.
Treasury Bonds
The Treasury Bond market made a . 618% retracement of the last down move to the exact tick. Treasury Notes made a . 786 retracement of the last down move. However the TLT which is the ETF for the Treasury Bonds could scarcely rally to the . 382%. This could portend further weakness.
Foreign Currency
The Japanese Yen still has an outstanding target at the $83.00 level. The Euro and the Pound have tested major support again this week (at $1.31, $1.44) should these critical levels be taken out it portends strength in the US Dollar and lower prices in the Euro and Pound.
Crude Oil
Crude Oil has made new lows this week but the relationship between Brent North Sea Oil (which is trading $12.00 a barrel higher than New York Sweet Crude) makes me question that this is a valid failure of the 3 drive pattern. The second reason I think it is a false new low is that gasoline futures and heating oil futures would not sell off during the oil break.
Gold
Gold stopped exactly at the . 618 retracement of the last low and immediately rallied $45.00 per ounce in a matter of hours coming off the $800.00 per ounce level. Gold has been the strongest commodity over the past year and it appears that it is gaining momentum for further upside movement. However, if we go below $750.00 per ounce I would have to assume that this analysis is incorrect.
Grains and Oil Seeds
This market rallied most of the week until a bearish crop report dampened prices. There is no potential pattern in soybeans, wheat or corn at this time.
The "Trade of the Year" in Treasury Bonds has started in the right direction. A strong move downward in Treasury Bonds (i.e., higher interest rates) would get us close to our first price objective in the TLT or TBT.
Robin thanks for sharing! Very kind of Larry to allow you to do this - please thank him for us. Robin perhaps you should start your own thread in Trading Strategies/Setups. This ES thread will soon get lost in space with each new day and that would be a shame. If you choose to do that, maybe you could give us an overview of your "style" of trading. Your a great new addition and welcome to the forum!
quote:
Originally posted by VOwater
Robin thanks for sharing! Very kind of Larry to allow you to do this - please thank him for us. Robin perhaps you should start your own thread in Trading Strategies/Setups. This ES thread will soon get lost in space with each new day and that would be a shame. If you choose to do that, maybe you could give us an overview of your "style" of trading. Your a great new addition and welcome to the forum!
VO we have a three day weekend...get a mic
i got one today!
Great stuff Robin, thank you and please thank Larry for us as well.
Emini Day Trading /
Daily Notes /
Forecast /
Economic Events /
Search /
Terms and Conditions /
Disclaimer /
Books /
Online Books /
Site Map /
Contact /
Privacy Policy /
Links /
About /
Day Trading Forum /
Investment Calculators /
Pivot Point Calculator /
Market Profile Generator /
Fibonacci Calculator /
Mailing List /
Advertise Here /
Articles /
Financial Terms /
Brokers /
Software /
Holidays /
Stock Split Calendar /
Mortgage Calculator /
Donate
Copyright © 2004-2023, MyPivots. All rights reserved.
Copyright © 2004-2023, MyPivots. All rights reserved.


