Question for AK1
Noticed your trade method today. Could you elaborate a little more? What kind of stop do you use and what targets do you set. How long have you been trading this and roughly how profitable is it? Thanks.
On todays ES Thread I have posted SL and profit targets. This is a tech. that follows the trend and doesn't need calculations/ patterns etc etc. You might agree that this tech. can be taught to a 10 yr old. One of my children actually sits and trades if I have to be away for a short short while. Ofcourse at that point I use only brackted order of 1:1. Also please feel free to contribute what ever you feel that may better the method. My Email is [email protected]. I started day trading 3 years back and haven't worked for anyone since that time.
Here is another trade
18:27:11 1 SELL_LIMIT 834.50
19:01:34 1 BUY_LIMIT 833.50
18:27:11 1 SELL_LIMIT 834.50
19:01:34 1 BUY_LIMIT 833.50
ak1, I noticed on that trade that the macd lines do cross, but they don't cross above the zero line. What are you considering a cross?
To me a cross is only above and below the zero line
what is your win/loss % with this kind of trading?
ak1 thanks for sharing your setup. Perhaps you should start your own thread otherwise this will just get lost in space eventually. Maybe BruceM can change the topic name for you. Just a suggestion.
Also, just to clarify- you are defining a "cross" when the macd and the macd ma actually cross the zero line. What about when the macd crosses above/below its ma? Do you trade those in the direction of cross as well or do you ignore those?
BruceM is my guru and he put me on the right track, so what ever he says is fine with me VO. You, KB and him want to build an army of day traders and my dream is to build a generation. That is why this tech. can easily be taught to children.
The win loss ratio is 4:1 einstein. The MACD I use is a common one that is available on all charting software including yahoo finance. The trigger line is the fast moving average line on MACD.
The win loss ratio is 4:1 einstein. The MACD I use is a common one that is available on all charting software including yahoo finance. The trigger line is the fast moving average line on MACD.
AK1.
Thanks for explaining your trade set up.
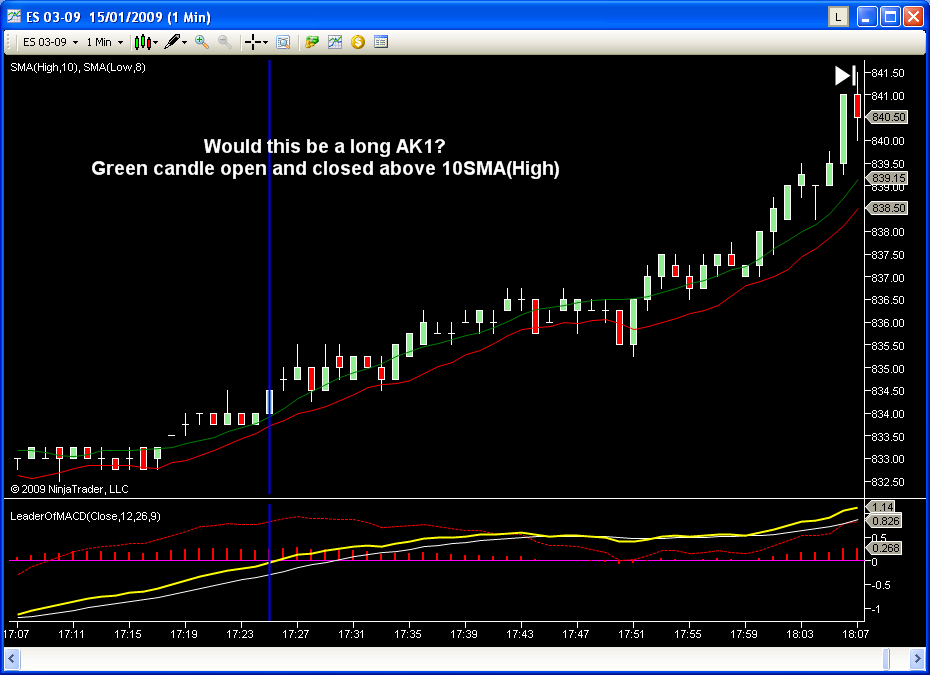
I have tried to set up my charts to the way that you explained in the 14-01-09 ES Forum.
How did I go?
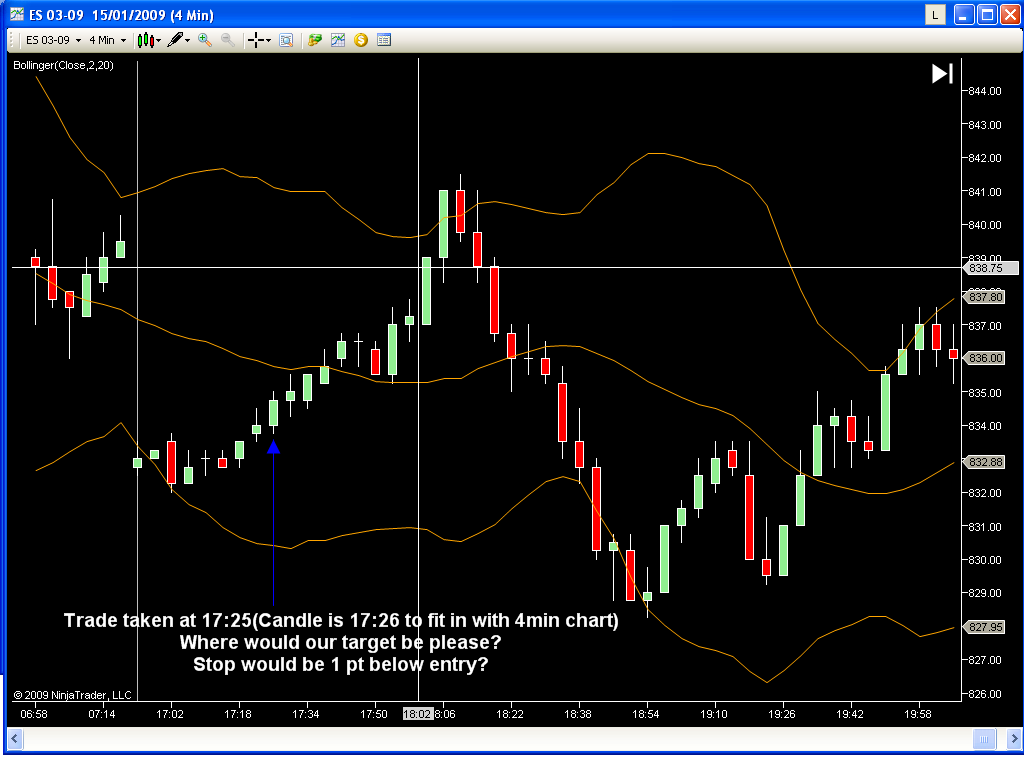
Would you be able to explain a little please in regards to the Bollinger targets. Do you have the Bolls set to close, High, Low...?
How do you go using a 1min chart to trade and a 4min for exiting?
Please note. The time on my charts are Australian. The trade outlined would have been at 1:26am Central Time(Chicago)
regards
In the first chart I would enter 834.75. That is on tick below the close of candle after the Doji (17:27). The target would be 839 on the 4 min chart (Second chart)8:06 candle I think
Sorry! Found it after more reading/searching.
Emini Day Trading /
Daily Notes /
Forecast /
Economic Events /
Search /
Terms and Conditions /
Disclaimer /
Books /
Online Books /
Site Map /
Contact /
Privacy Policy /
Links /
About /
Day Trading Forum /
Investment Calculators /
Pivot Point Calculator /
Market Profile Generator /
Fibonacci Calculator /
Mailing List /
Advertise Here /
Articles /
Financial Terms /
Brokers /
Software /
Holidays /
Stock Split Calendar /
Mortgage Calculator /
Donate
Copyright © 2004-2023, MyPivots. All rights reserved.
Copyright © 2004-2023, MyPivots. All rights reserved.

