Charts 1-14-09
I see so many complicated charts, with dozens of indicators, sometimes makes my head spin
Here is something real simple
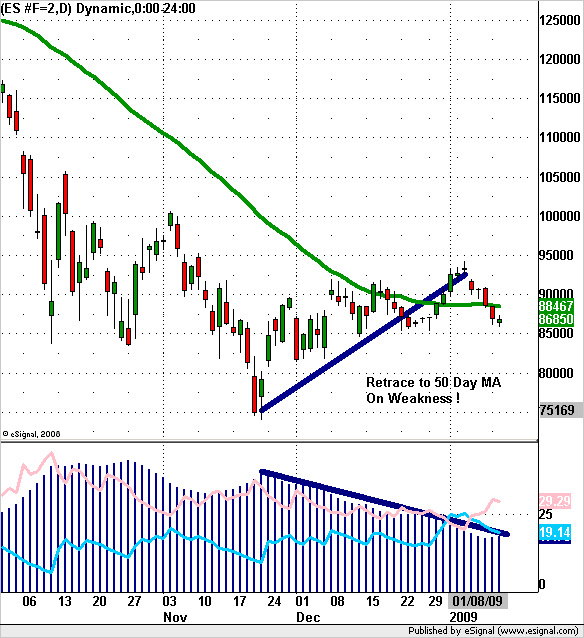
Here is a simple daily chart of the E-mini SP 500, with just 2 charting indicators. 2 indicators keep things real simple.
A 14 day ADX combined with a 50 day simple moving average. As you can see the bounce of the lows of the SP 500, (or E-mini) made on November 21, 2008 did bounce or retrace to its mean as defined here by the 50 day moving average As we can also see the bounce was done a basis of declining strength.
The ADX is a good indicator for a pure measure of strength, and in my own personal experience tends to work better on longer time frames than on shorter ones A bounce on weakness suggests that the big money has yet to step back into the market and gives greater weight to the Markets Like to Retest Prior Lows theory
![]()
[email protected]
Here is something real simple
Here is a simple daily chart of the E-mini SP 500, with just 2 charting indicators. 2 indicators keep things real simple.
A 14 day ADX combined with a 50 day simple moving average. As you can see the bounce of the lows of the SP 500, (or E-mini) made on November 21, 2008 did bounce or retrace to its mean as defined here by the 50 day moving average As we can also see the bounce was done a basis of declining strength.
The ADX is a good indicator for a pure measure of strength, and in my own personal experience tends to work better on longer time frames than on shorter ones A bounce on weakness suggests that the big money has yet to step back into the market and gives greater weight to the Markets Like to Retest Prior Lows theory
[email protected]
THE BRADLEY CHART I POSTED SIMPLY REINFORCES THE 23RD AS POSSIBLY THE MOST IMPORTANT DATE OF THE TWO DATES I HAVE PREVIOUSLY GIVEN TO WATCH!
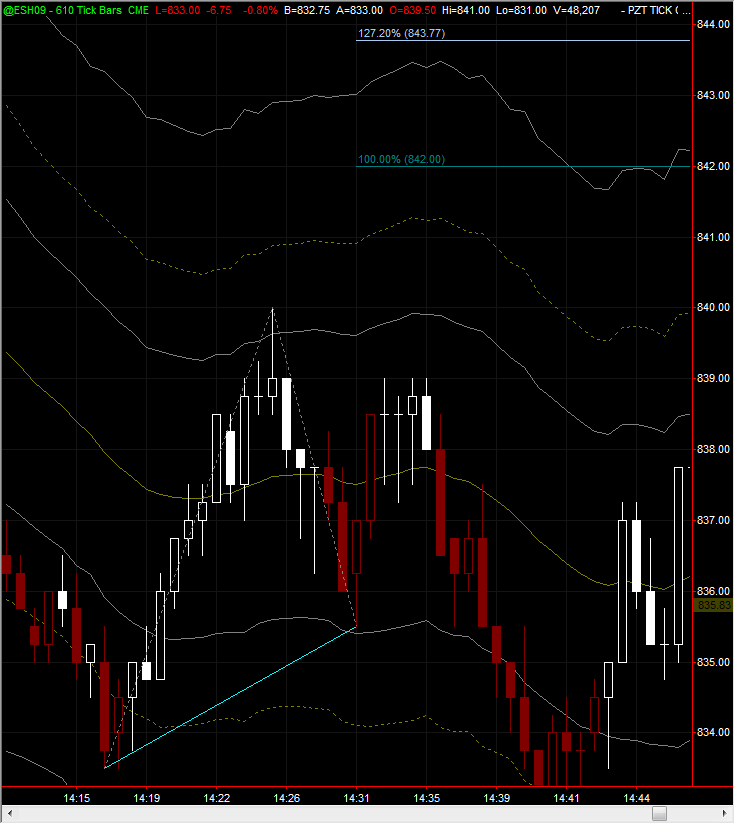
They don't always work out. This was a beautiful ABC setup. Price had moved all the way across the fibo bands and made a move above the MA to the 1.618 band. It then retraced back down through the MA to the 61.8% and the opposite 1.618 band. We had a nice bullish candle that shot back through the MA and gave an entry. This is a classic setup (my favorite) and in my experience the most reliable, however, as you can see it didn't follow through and stop was taken.
Emini Day Trading /
Daily Notes /
Forecast /
Economic Events /
Search /
Terms and Conditions /
Disclaimer /
Books /
Online Books /
Site Map /
Contact /
Privacy Policy /
Links /
About /
Day Trading Forum /
Investment Calculators /
Pivot Point Calculator /
Market Profile Generator /
Fibonacci Calculator /
Mailing List /
Advertise Here /
Articles /
Financial Terms /
Brokers /
Software /
Holidays /
Stock Split Calendar /
Mortgage Calculator /
Donate
Copyright © 2004-2023, MyPivots. All rights reserved.
Copyright © 2004-2023, MyPivots. All rights reserved.


