ES 1-6-2008
Good Morning Traders !
VAH 930.50
POC 925.50
VAL 922.00
Weekly R1: 954.50
Weekly PP: 904.00
Daily R2: 944.00
Daily R1: 935.75
Daily PP: 926.00
Highest High in last 20 trading days: 934.25
I will be watching what happens at R1 with great interest this morning ! Also watch the IB high for indications of a trend day if price is accepted above R1.
ES Daily Notes 5 Jan 2009
thanks PWD
quote:
Originally posted by myptofvu
I thought for the 80% rule you had to start within the the VA then if you broke out a bit and came back inside it had an 80% chance of reaching the opposite VA.
That may be true but its not how I was taught. I was taught any breach into value from ourtside of it from either end, and a hold into 2 periods, triggers it and it stays valid until it fulfills or fails. Even when it fails I have been taught to watch for unfulfilled "80%s" because like gaps, they eventually fulfill / fill.
quote:
Originally posted by prestwickdrive
quote:
Originally posted by myptofvu
I thought for the 80% rule you had to start within the the VA then if you broke out a bit and came back inside it had an 80% chance of reaching the opposite VA.
That may be true but its not how I was taught. I was taught any breach into value from ourtside of it from either end, and a hold into 2 periods, triggers it and it stays valid until it fulfills or fails. Even when it fails I have been taught to watch for unfulfilled "80%s" because like gaps, they eventually fulfill / fill.
Thanks PWD
quote:
Originally posted by BruceM
Hey PWD...how fast have you seen the "BIGS" flip from net long to net short? Reason I'm asking is that I'm wondering what it looks like on your chart when the rally it up like they did this morning and then roll it over....thanks
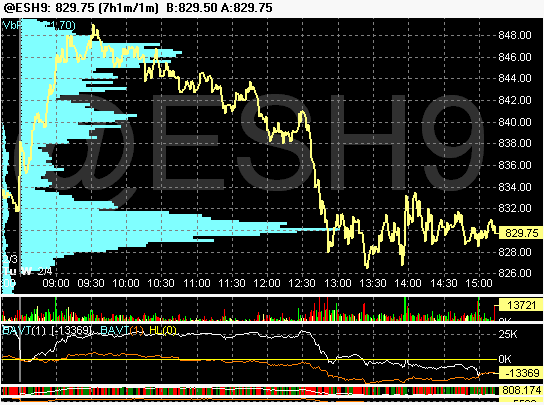
Bruce - Here is today's action so far. Bigs are the white line. Right after I said smalls were starting to sell they bought fairly hard and bigs bought off of their net zero line too. The number on the right is the big $ level but the scale tis the same on this chart for bigs and smalls.
quote:
Originally posted by myptofvu
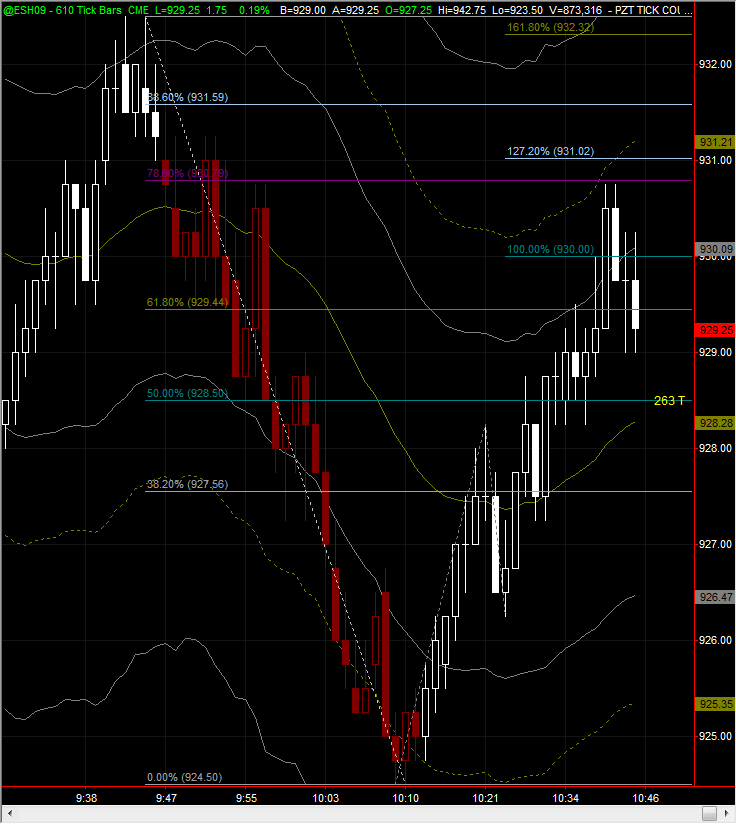
long @924.75 off the Triple Lindey
looking for 928.75
quote:
Originally posted by myptofvu
quote:
Originally posted by myptofvu
long @924.75 off the Triple Lindey
looking for 928.75
moved stop to lock in 2 pts
out +4
nice trade mypto
resting order sell 31.50 2,25 stop if it gets there
Thanks PT. Very much appreciated the time and thought that you have put into the questions I asked.
I have still a lot to learn.
Regards
A
I have still a lot to learn.
Regards
A
Emini Day Trading /
Daily Notes /
Forecast /
Economic Events /
Search /
Terms and Conditions /
Disclaimer /
Books /
Online Books /
Site Map /
Contact /
Privacy Policy /
Links /
About /
Day Trading Forum /
Investment Calculators /
Pivot Point Calculator /
Market Profile Generator /
Fibonacci Calculator /
Mailing List /
Advertise Here /
Articles /
Financial Terms /
Brokers /
Software /
Holidays /
Stock Split Calendar /
Mortgage Calculator /
Donate
Copyright © 2004-2023, MyPivots. All rights reserved.
Copyright © 2004-2023, MyPivots. All rights reserved.

