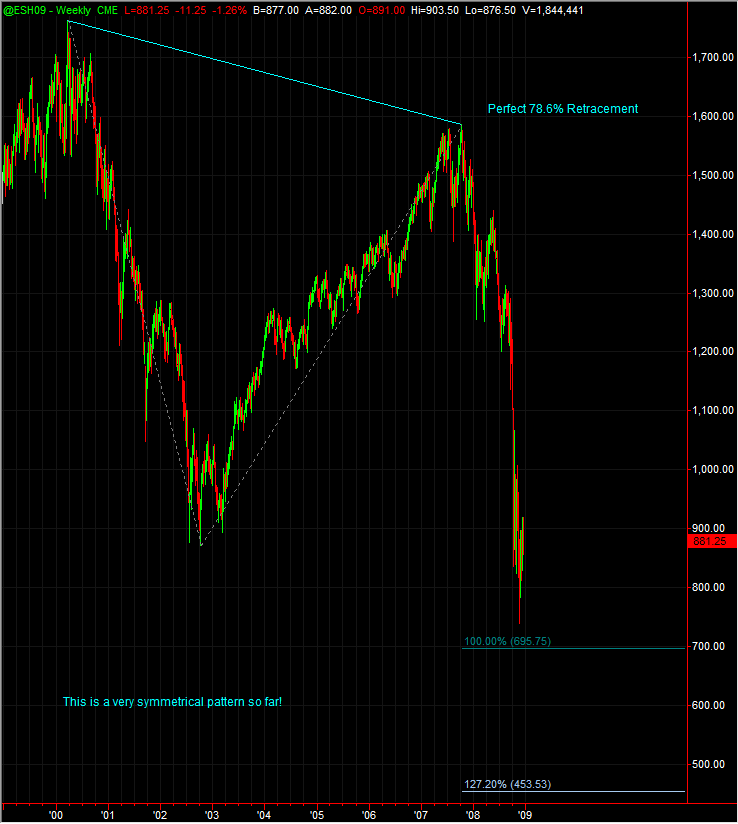
12-19-08 charts
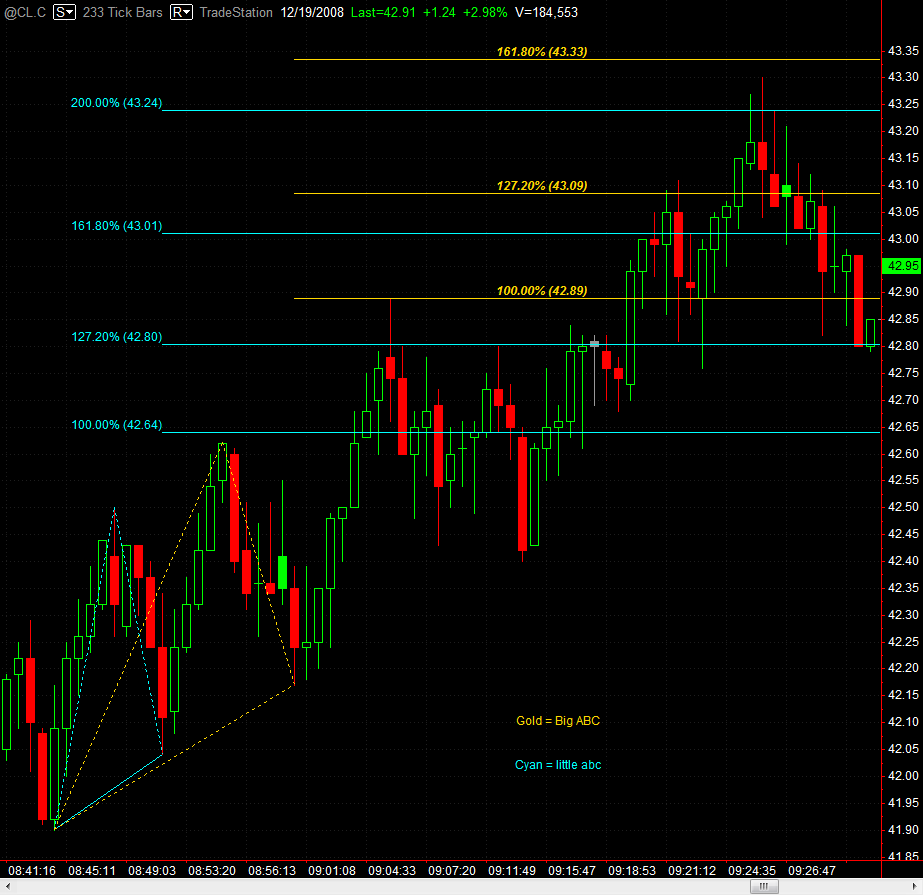
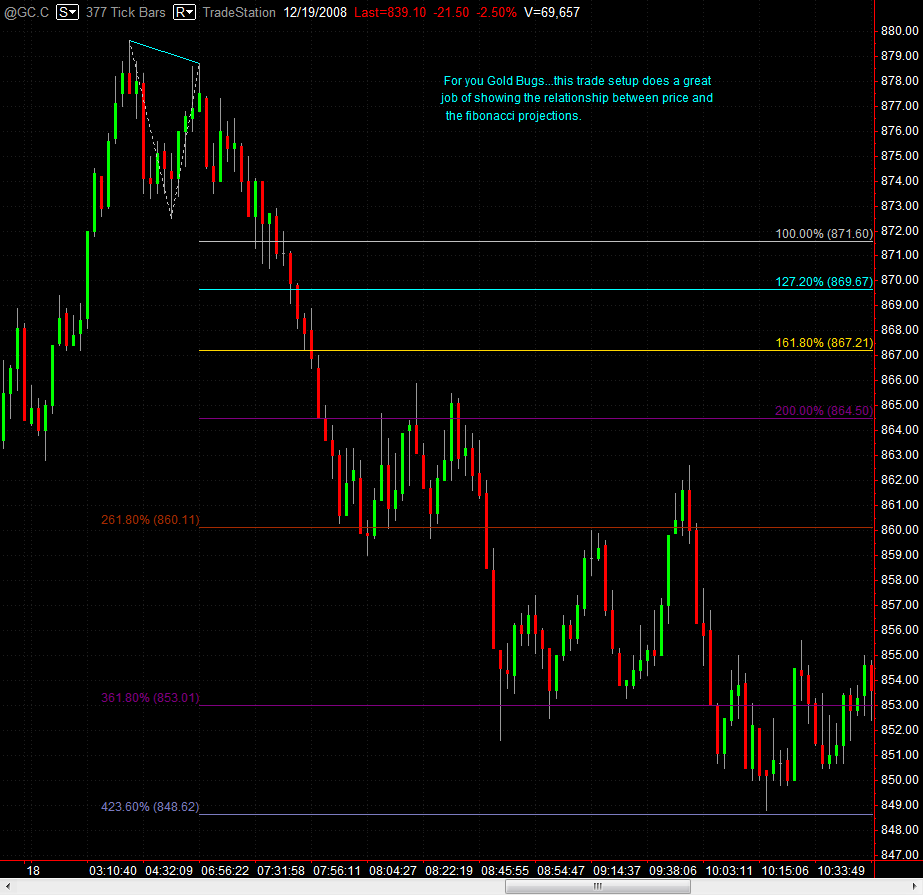
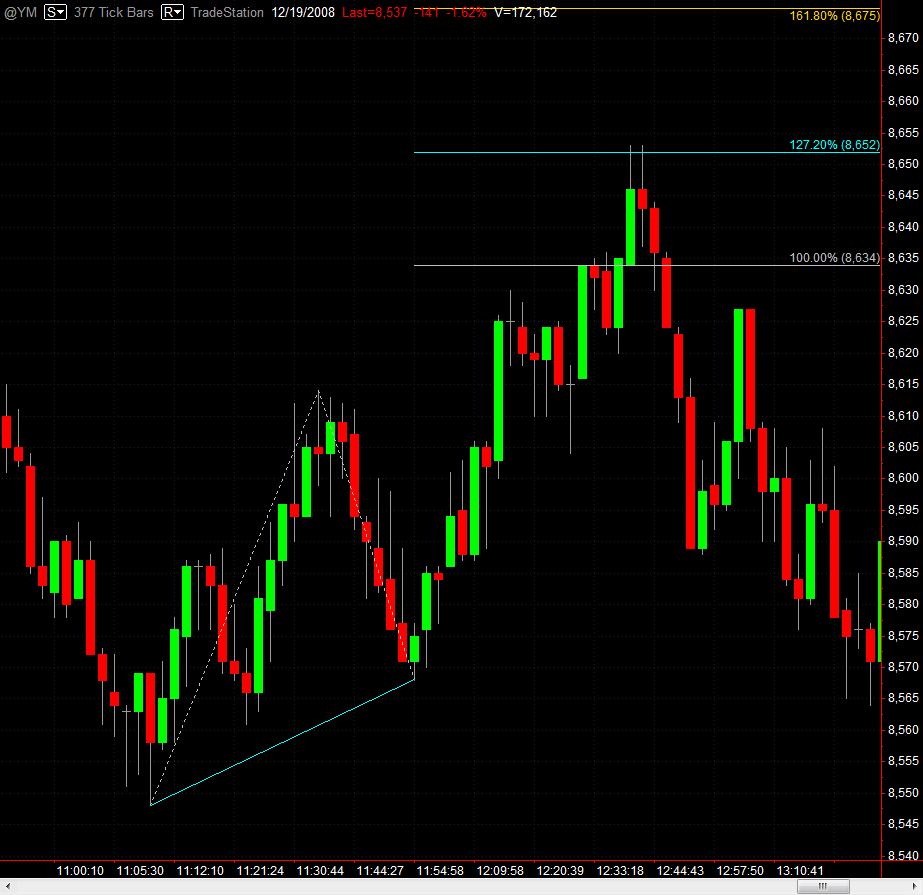
Here is some crude action...I hesitated to have both of these on 1 chart...hope there isnt any confusion.
Here you go Bruce. The inset fib projections come from the ABC (cyan) that you can see. The outermost projections are from our top (not viewable).
VO:
Your charts are really bringing these Fibonacci relationships alive !
Your ABC pattern combined with the market reaction at that 161.8 line is true genius. It's simple and it works.
Your charts are really bringing these Fibonacci relationships alive !
Your ABC pattern combined with the market reaction at that 161.8 line is true genius. It's simple and it works.
quote:
Originally posted by VOwater
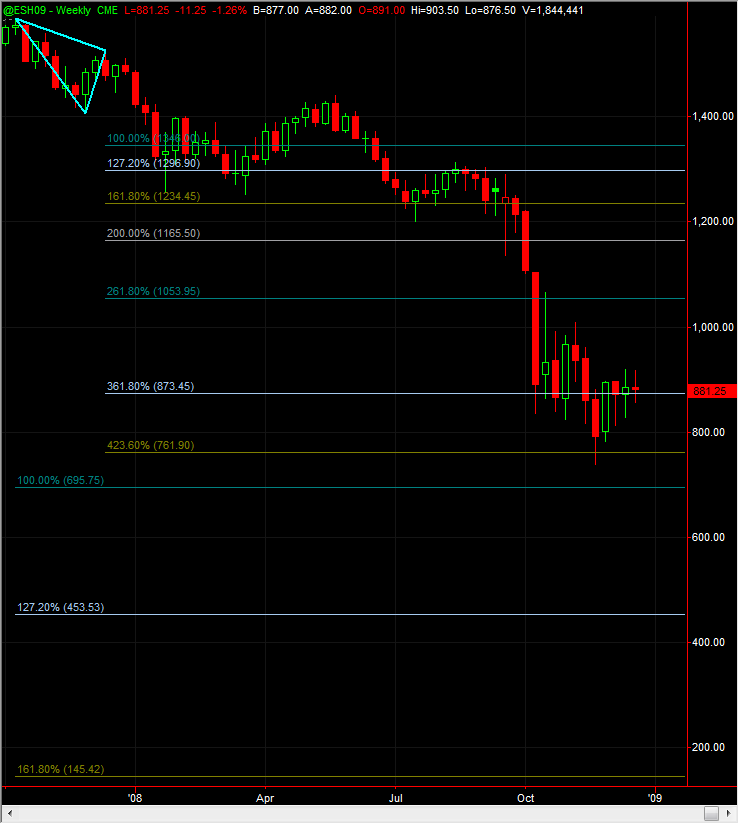
here is a look at what the upside might have in store
I don't think the upside will occur. As they say in Wall Street, "As January goes, the year goes".
Beginning of 2008 started with 1478+ in the S&P. Now, it is almost half. I'd think it will end down trend to the end of the year. Your projection to the end of the year close from 706 to 752 is very possible. 739 is half of where the year started.
January? Who knows? It is a good watch for the expectancy for the rest of the year.
Emini Day Trading /
Daily Notes /
Forecast /
Economic Events /
Search /
Terms and Conditions /
Disclaimer /
Books /
Online Books /
Site Map /
Contact /
Privacy Policy /
Links /
About /
Day Trading Forum /
Investment Calculators /
Pivot Point Calculator /
Market Profile Generator /
Fibonacci Calculator /
Mailing List /
Advertise Here /
Articles /
Financial Terms /
Brokers /
Software /
Holidays /
Stock Split Calendar /
Mortgage Calculator /
Donate
Copyright © 2004-2023, MyPivots. All rights reserved.
Copyright © 2004-2023, MyPivots. All rights reserved.

