ES 12-16-08
GM Traders
Daily PP: 873.75
R1: 891.50
S1: 854.75
POC: 868.25
60m: 903.50 / 848.50
15m: 903.50
overnight globex gap @ 874.25
Daily PP: 873.75
R1: 891.50
S1: 854.75
POC: 868.25
60m: 903.50 / 848.50
15m: 903.50
overnight globex gap @ 874.25
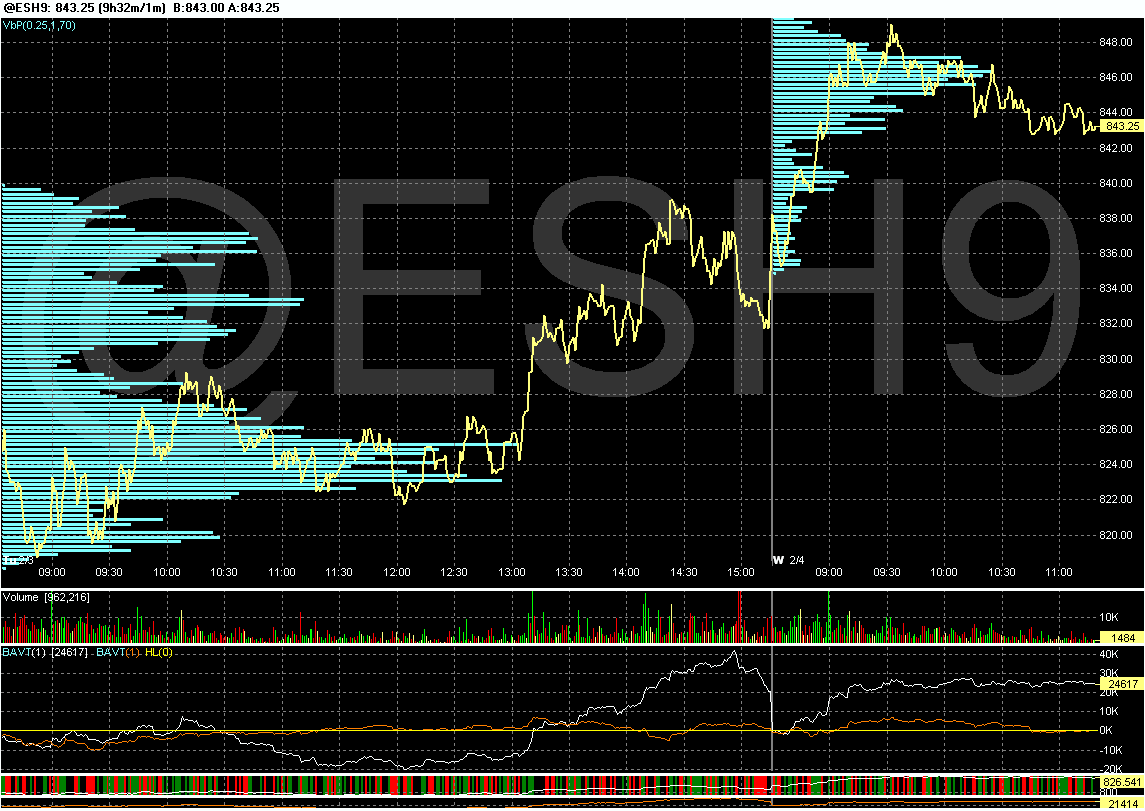
Here is the picture. Bigs are the white BAV line against the right measurement axis (ended day +102611 net contracts)and small traders are the brown BAV line against the left measurement axis. It looks like small were closer to a net -30k.
thanks and based on this that day should be a pivot day right?
volume unimpressive
IF I MAY BE SO BOLD.... 

yep VO i agree- not much volume. That's how you know it is not real buying to end the bear market.
nOTE O/N vos CHART DECLINING VOL THE WHOLE RALLY ...very typical of an ending diagonal!
quote:
Originally posted by koolblue
nOTE O/N vos CHART DECLINING VOL THE WHOLE RALLY ...very typical of an ending diagonal!(or bear flag or whatever!)
kool I would love to see it get there...when we see a big volume day to the upside you will know their distributing
NOTE ALSO LEG A IS 918-739=179HANDLES AND .618 OF THAT IS 110.50 ADDED TO 813 IS 923.50 AND IF YOU USE THE 817 LOW = ABOUT 927.50... LOTTA FIB RELATIONSHIPS AROUND THAT 927-932 AREA
Thanks for all the charts and goodies today folks........I enjoy it all but today I really enjoyed Prestwicks updates on what the "super powers" where up to...cool stuff
Emini Day Trading /
Daily Notes /
Forecast /
Economic Events /
Search /
Terms and Conditions /
Disclaimer /
Books /
Online Books /
Site Map /
Contact /
Privacy Policy /
Links /
About /
Day Trading Forum /
Investment Calculators /
Pivot Point Calculator /
Market Profile Generator /
Fibonacci Calculator /
Mailing List /
Advertise Here /
Articles /
Financial Terms /
Brokers /
Software /
Holidays /
Stock Split Calendar /
Mortgage Calculator /
Donate
Copyright © 2004-2023, MyPivots. All rights reserved.
Copyright © 2004-2023, MyPivots. All rights reserved.

