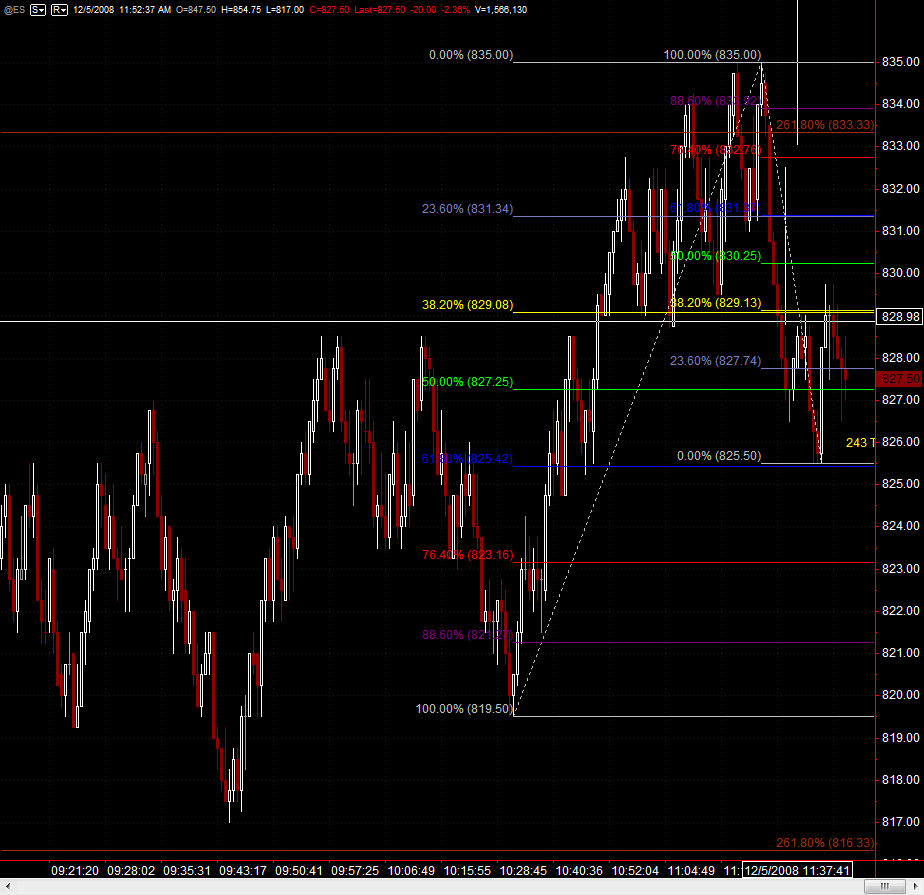
ES 12-05-08
GOOD MORNING ALL! Well as you know im not a big fan of longer term forecasts, but i keep getting asked so much that thats why i posted some views the other day on the globex thread and the trading strategies forum. I bring it up not to receive plaudits but because im trying to 'teach' you that the techniques i have shown you here(price proj. and cycles) work on any time frame and in any market for that matter! I have always made good money from the markets but my dream has always been to create an 'army' of traders as skilled (or better!) as i am to level the playing field at this giant casino we call the financial markets. When i made the case for a top in the market tue-wed with 872.50-877 being the prime resistance area im sure most were skeptical, and heck, coming off of the most oversold market in history thats understandable.
im not selling, which means its going lower probably
ROFL...YOU BEGINNING TO SOUND LIKE ME!
my problem is we too much in a range-
i rather short that 856 or 846 area
i rather short that 856 or 846 area
somebody mentioned were in a wave 4 and thats what it looks like to me with 5 being up...thats my opinion from our move off the bottom
fwiw 5 min is calling for 813 unless 835 is touched again.. but im cancelling my sell for now
heres a good shot of what im looking at...if im right well have a hellva abc to 41, 45.25, 50.50
crude -6.2% @ LOD
that's a pretty tight channel for the moment
that charts a little messy with proj's, but look at the price waves
im gambling we go higher.. you only have to look at the chart to see why its stalled here.. 5 min boll 1 min boll and 1 min avg all at 829 -830 thats why i thought it would be good for a short scalp(and thats proving to be the case ).. so far
Welcome to the forum UKtradergirl
These dynamic charts (volume and tick charts) take a little getting used to at first. VO uses a 610 tick chart which matches my volume chart fairly closely.
These dynamic charts (volume and tick charts) take a little getting used to at first. VO uses a 610 tick chart which matches my volume chart fairly closely.
Emini Day Trading /
Daily Notes /
Forecast /
Economic Events /
Search /
Terms and Conditions /
Disclaimer /
Books /
Online Books /
Site Map /
Contact /
Privacy Policy /
Links /
About /
Day Trading Forum /
Investment Calculators /
Pivot Point Calculator /
Market Profile Generator /
Fibonacci Calculator /
Mailing List /
Advertise Here /
Articles /
Financial Terms /
Brokers /
Software /
Holidays /
Stock Split Calendar /
Mortgage Calculator /
Donate
Copyright © 2004-2023, MyPivots. All rights reserved.
Copyright © 2004-2023, MyPivots. All rights reserved.
