ES 11-25-08
daily: 1073 / 736.25
60m: 910.75, 899.50
15m: 916, 884
5m: 875.50,
need to retrace a bit before we get any downside projections
60m: 910.75, 899.50
15m: 916, 884
5m: 875.50,
need to retrace a bit before we get any downside projections
well actually, that would be how you would look for the next downside target...to find the upside you need to go from L to H or R to L...but you got a number that was right on...hmmm
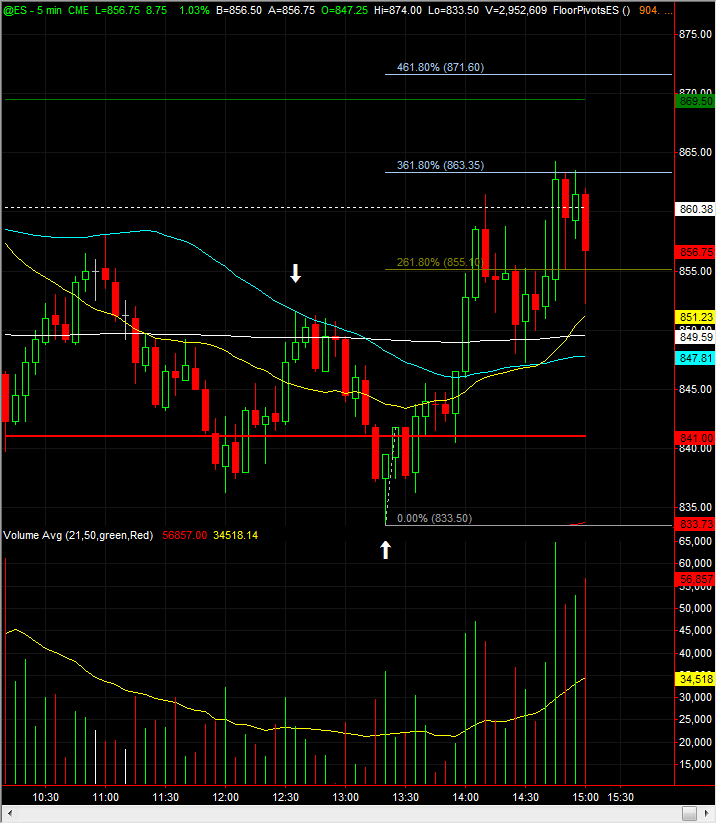
prestwick heres a snapshot where you can see how I got thee 855 number and higher proj's. I marked with arrows where you got your number, and as I said this is how you would find a downside proj. Have you been getting good numbers this way?
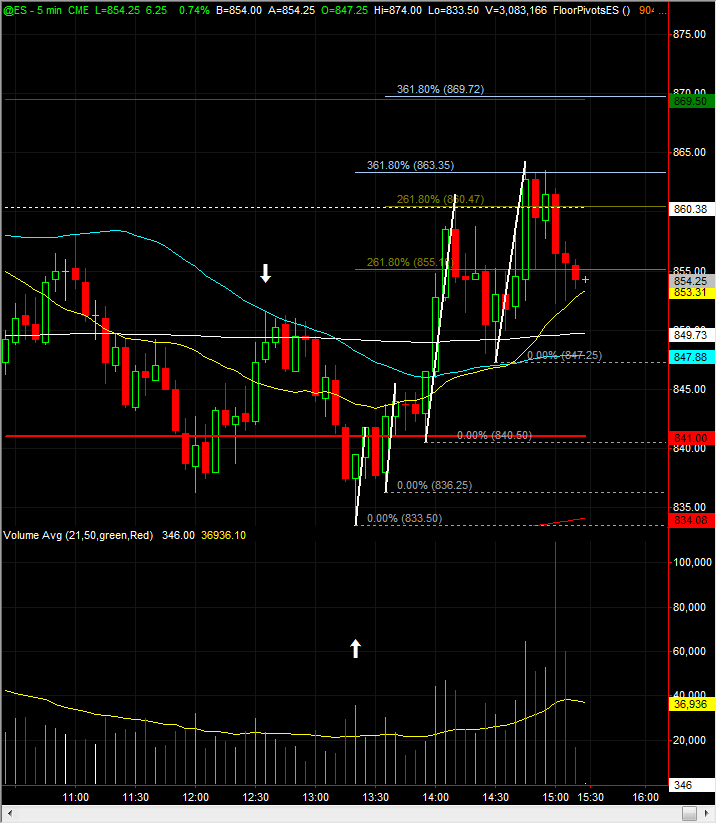
ok prestwick that chart doesnt show very well, but if you look at the 33.50 bar you see a white dotted line. I then used the next bar because the bar after that failed to make higher high and had a good retrecement. And to make it easy I just throw a fib retracement tool on there. Does this make sense?
here are the current 5m projections. This should be easier to see, I have highlighted the bars that go into the calc's. These numbers will be good until they are either reached or the low (white dotted line) are taken out. Hope this helps. Id still like to know if your numbers have been comming in the way you do it.
Thanks VO. I haven't been working with Kool's cycle projection tool much and was experimenting this PM. I was using the cycle highs and lows and using 1.618 from the end of the cycle. In my notes I had Kool saying to use 2.618 from the beginning of the cycle. Using the 1.618 I had a cycle H to L of 17.5 when fibbed by 1.612 gave me a 28.25 point expectation which added to the cycle low of 833.5 gave me a 61.75 target. For that second cycle projection that negated I had 61.5 - 47.25 = 14.25 * 1.618 = 23 + 847.5 (cycle low)= 870.5 target. That's the one that didn't hit at the end of the session. Maybe I am oversimplifying it.
Emini Day Trading /
Daily Notes /
Forecast /
Economic Events /
Search /
Terms and Conditions /
Disclaimer /
Books /
Online Books /
Site Map /
Contact /
Privacy Policy /
Links /
About /
Day Trading Forum /
Investment Calculators /
Pivot Point Calculator /
Market Profile Generator /
Fibonacci Calculator /
Mailing List /
Advertise Here /
Articles /
Financial Terms /
Brokers /
Software /
Holidays /
Stock Split Calendar /
Mortgage Calculator /
Donate
Copyright © 2004-2023, MyPivots. All rights reserved.
Copyright © 2004-2023, MyPivots. All rights reserved.


