TTT cycles applied
TTT 3 Day cycle
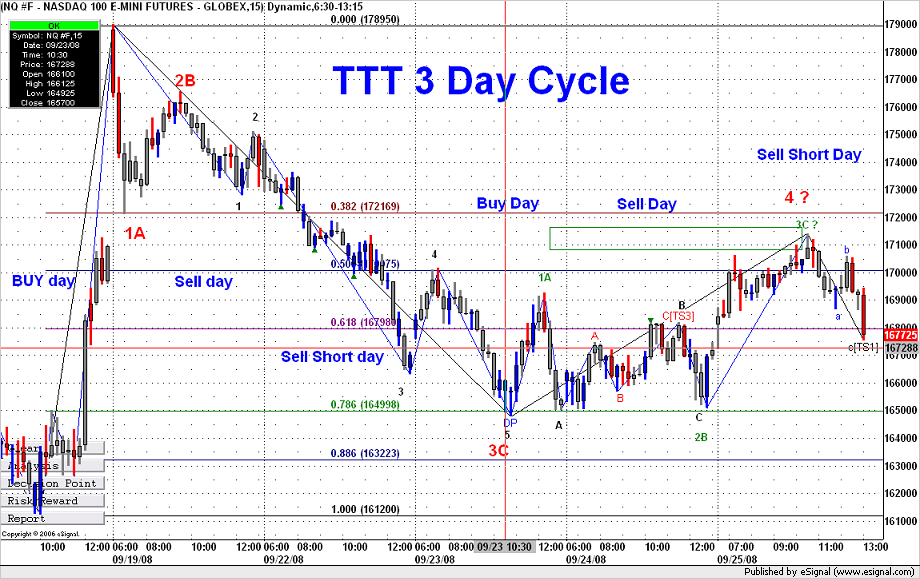
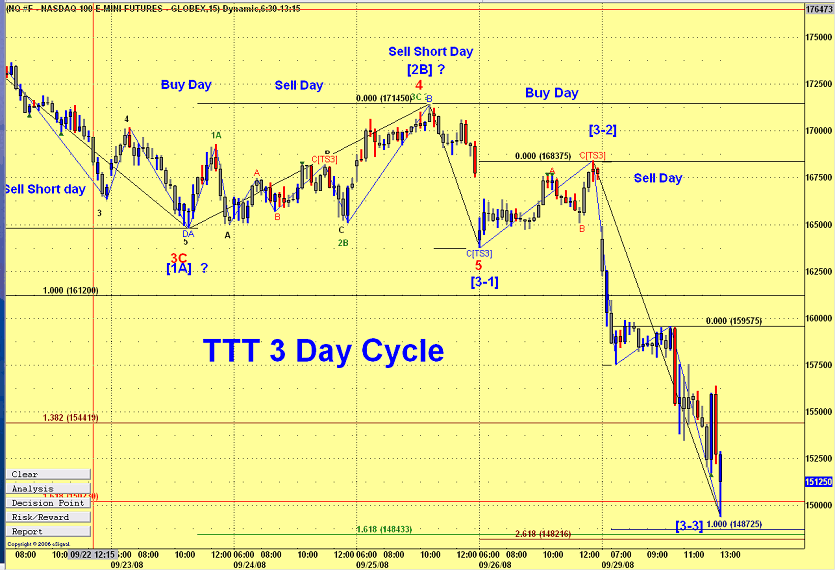
Using this chart we can see the TTT pattern for the last 2 cycles.
Sept 18 was Buy day and after a decline we found our buy point at 1612-15 area. The market then rallied and blew right through any projections to a top on the Sell day. We then started to correct that extreme move on the Sell day and continued on the SellShort day
and came down to close as a normal average 3 day rally.
Sept 23 starts a new cycle. We had done a good decline already but we had a 62% chance of making a lower low and that was accomplished.
Sept 24 the Sell day (confusing day) we rallied a bit but it was more a back and fill day.But as you can see that completed our wave 2B.
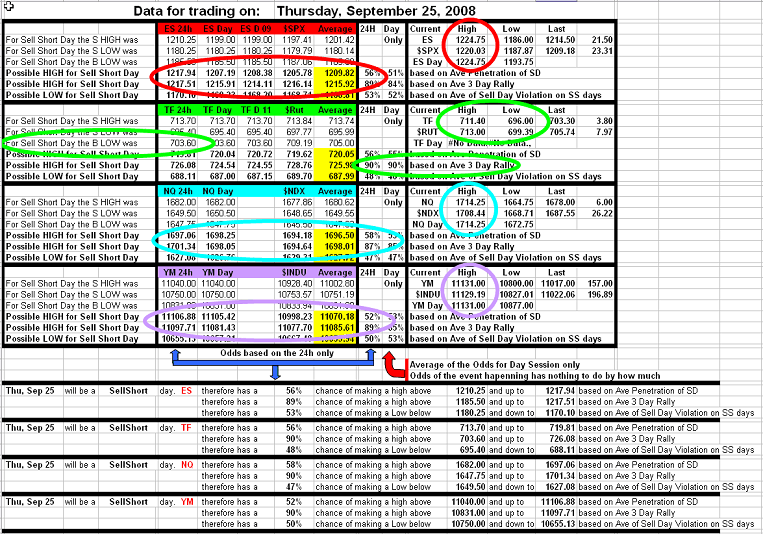
Today was a SS day. TF opened below the Buy day low and therefore as mentioned is last night's report we had a 90% chance of getting above 703.60 at some time during the session and that was achieved. The others were far from the average 3 day rally, therefore the expect rally was to be anticipated.
NQ today rallied all the way to the DP which was just a bit higher then the projected highs
Lets continue where we left off.
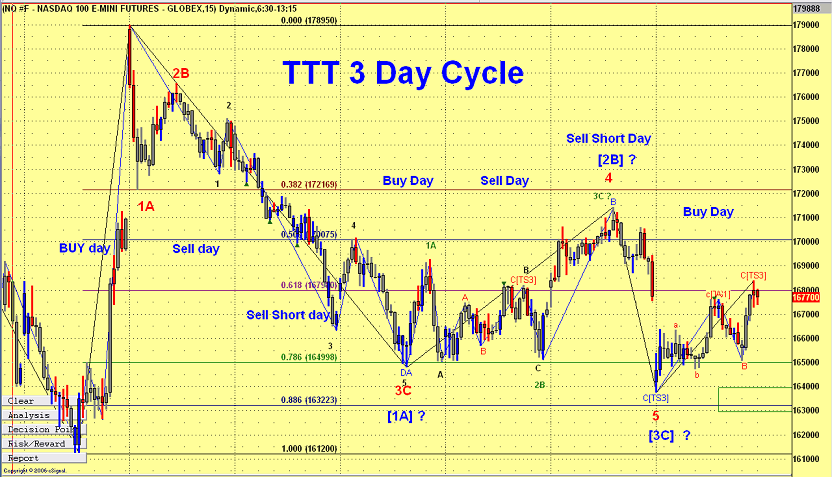
Today was a Buy day for NQ and we had a DP a little lower the the TTT projected lows. With the large gap at the open we rallied from that low until the gap got close nearly at the close.
Today was a Buy day for NQ and we had a DP a little lower the the TTT projected lows. With the large gap at the open we rallied from that low until the gap got close nearly at the close.
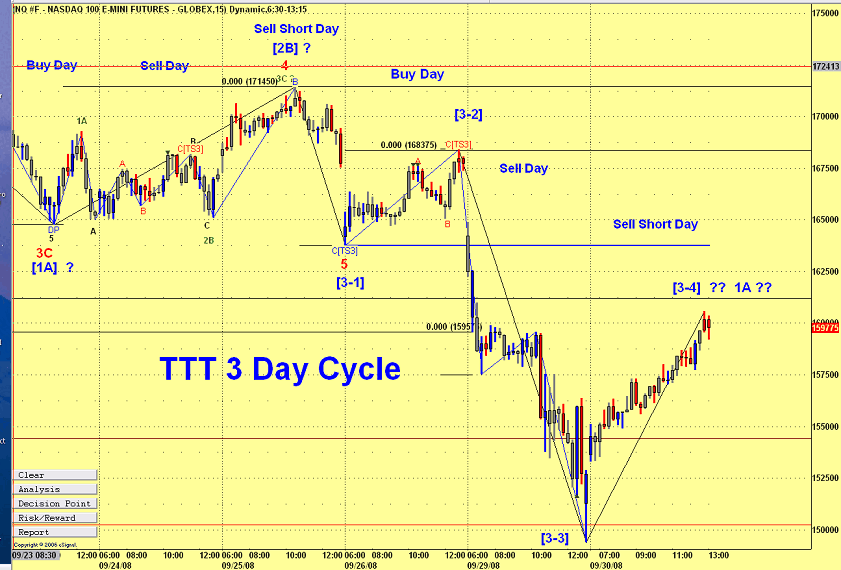
To continue with the same chart Today was a Sell day and as mentioned in Friday's report we had rallied to a level that contituted an average rally and therefore could expect a decline from there. And a decline we got, stopping for a pause at or close to the projected numbers only to continue lower. We are now close to numerous Fib areas and wave 3-3 is nearly 100% of wave 3-1.
We could still make 5 waves. Tomorrow is a SS day and a rally could be anticipated since we have very high odds of getting above the Buy day low.
We could still make 5 waves. Tomorrow is a SS day and a rally could be anticipated since we have very high odds of getting above the Buy day low.
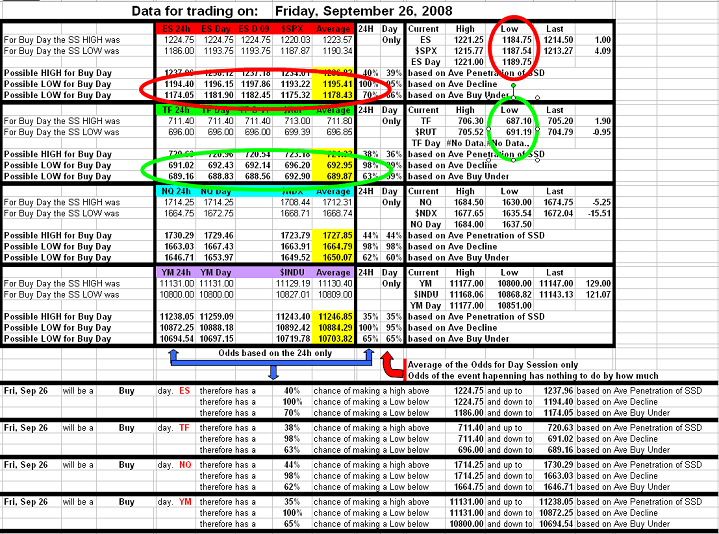
Today was the SS day and like I mentioned in my comments last night we needed to get back above the Buy day low.
TF and YM made it, ES and NQ gave it a college try and came close
TF and YM made it, ES and NQ gave it a college try and came close
Emini Day Trading /
Daily Notes /
Forecast /
Economic Events /
Search /
Terms and Conditions /
Disclaimer /
Books /
Online Books /
Site Map /
Contact /
Privacy Policy /
Links /
About /
Day Trading Forum /
Investment Calculators /
Pivot Point Calculator /
Market Profile Generator /
Fibonacci Calculator /
Mailing List /
Advertise Here /
Articles /
Financial Terms /
Brokers /
Software /
Holidays /
Stock Split Calendar /
Mortgage Calculator /
Donate
Copyright © 2004-2023, MyPivots. All rights reserved.
Copyright © 2004-2023, MyPivots. All rights reserved.
