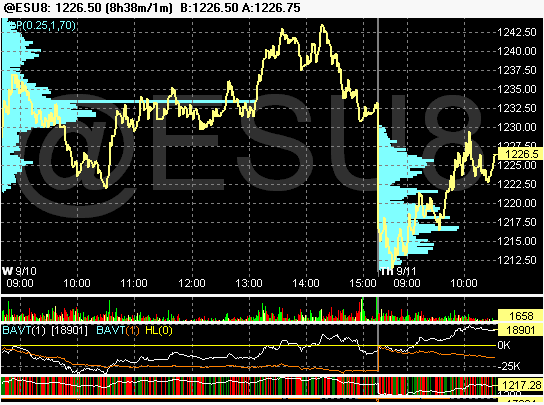
ES-09-11-08
Lots of discussion about ticks yesterday.WEEKS ago, i pointed out a relationship that has ocurred with incredible accuracy over the last 5 years. Anytime the closing ticks on the nyse is above 800 a significant decline ensues within two trading days.last time , i noticed this i posted it i think aug. 15.Two days later we hit 1303.50 on the e- mini and slammed down about 40 points.Yesterday i noticed plus 853 near the close!I wish some one could backtest this as i have no capacity to do so. The accuracy seems incredible, but more study is needed to be sure.Im not even sure what we closed at on the ticks , but if it was above 800, look out below!
hope we dont get above your poc!
not a good idea to short on range extensions coming of oversold levels...yikes!
I'll try posting a BAV view again. The big money action has been consistent buying from the low after the open while small money has been net selling. This was the picture just before the last break upwards.
Scratched a point
Sorry about the double chart post. I had only told it to attach one. Big money was net +18901 contracts for the day at the time of this snapshot (highlighted number on the right of the BAV study. They are +19895 now with the ES at 1231 so they aren't buying as aggressively now (possible slight divergence).
Nice charts drive,
I downloaded that soft ware yesterday and could find the BAV, where is it located?
I downloaded that soft ware yesterday and could find the BAV, where is it located?
im lowering my stop to 1233.50, im either right or wrong here.
covering here
There's was a nice Neg divergence in the TICK MA, but I would have liked to see it higher, like in the 500's this one was in the 250's which makes me think this run had more to go.
out at 1229.25,plus 2.25, tho i have projections to 1223.50-1224.50
By the way, Joe, theres going to another gap to be filled come Mon. lol!...stay tuned!
Emini Day Trading /
Daily Notes /
Forecast /
Economic Events /
Search /
Terms and Conditions /
Disclaimer /
Books /
Online Books /
Site Map /
Contact /
Privacy Policy /
Links /
About /
Day Trading Forum /
Investment Calculators /
Pivot Point Calculator /
Market Profile Generator /
Fibonacci Calculator /
Mailing List /
Advertise Here /
Articles /
Financial Terms /
Brokers /
Software /
Holidays /
Stock Split Calendar /
Mortgage Calculator /
Donate
Copyright © 2004-2023, MyPivots. All rights reserved.
Copyright © 2004-2023, MyPivots. All rights reserved.
