ES 09-10-08
fixed Sq 9
1297
1279
1261
1243
1225
1208
1191
1174
Dated Sq 9
1283
1267.5
1247
1232
1212
1198
I'll post $PREM buy and sell programs in the A.M.
1297
1279
1261
1243
1225
1208
1191
1174
Dated Sq 9
1283
1267.5
1247
1232
1212
1198
I'll post $PREM buy and sell programs in the A.M.
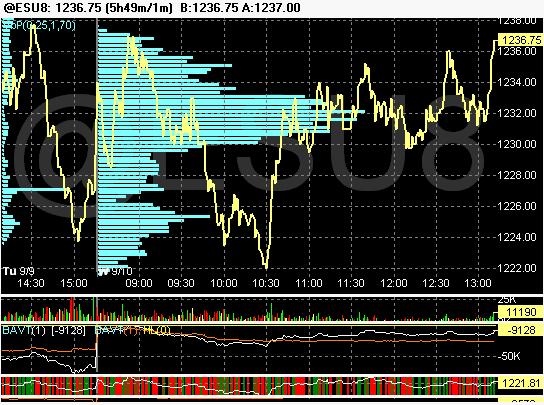
out 1241.50...up 12.50 for the day.. thats all for me.Wonder if well get to my 1247-8 number or not?
I hope so...
Big $ is now +13500 contracts. In the chart above they were -9128 from the pit opening today.
Sorry POp...no stats,,but I can tell you this that it works great during consolidation periods....Lunchtime etc....but I'd be careful after 2:30 as the odds of a trending movement seem greater....
If you are researching this I wouldn't limit this to new high or low divergences...you can also check on previous 30 minute bars where one makes a new high/low but the other doesn't
If you are researching this I wouldn't limit this to new high or low divergences...you can also check on previous 30 minute bars where one makes a new high/low but the other doesn't
quote:
Originally posted by popstocks
quote:
Originally posted by BruceM
a trade I missed: Dow breaks it's hour highs after it breaks it's lows...S&P doesn't.break it's highs..go short either market
Interesting approach, have you backtested it? If so what are the probabilities like? thx
quote:
Originally posted by BruceM
Sorry POp...no stats,,but I can tell you this that it works great during consolidation periods....Lunchtime etc....but I'd be careful after 2:30 as the odds of a trending movement seem greater....
If you are researching this I wouldn't limit this to new high or low divergences...you can also check on previous 30 minute bars where one makes a new high/low but the other doesn'tquote:
Originally posted by popstocks
quote:
Originally posted by BruceM
a trade I missed: Dow breaks it's hour highs after it breaks it's lows...S&P doesn't.break it's highs..go short either market
Interesting approach, have you backtested it? If so what are the probabilities like? thx
Sounds cool, I only can backtest on a bout 20 days of intraday but I will have a looksie and report when I get some free time.
Cheers
I had 45 as my next zone up top......reason is we have that ledge from yesterday at 44.75 and one at 54.75....cool day..
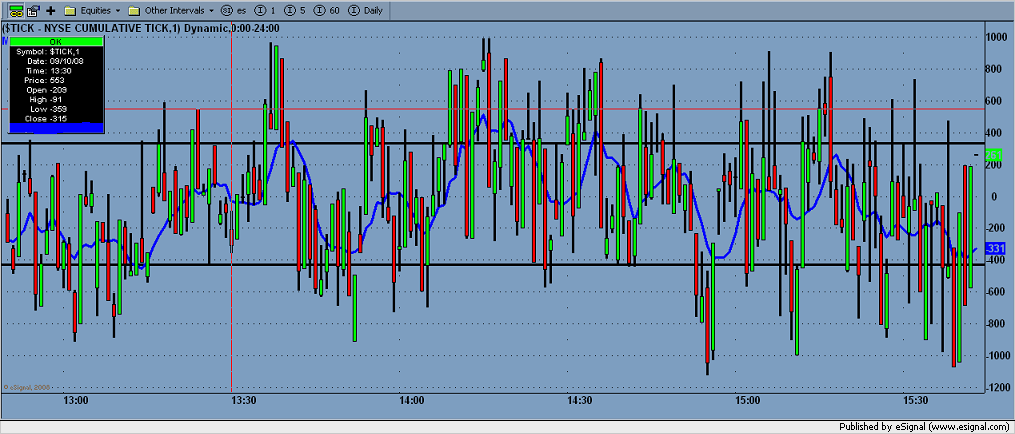
Counter trend for me.....If I was an indicator and chart wizard I would try and code a Volume/tick combo indicator which would show when we have high or low readings in the tick while we have high readings in volume........it would cut down on my screen real estate and probably make life easier
quote:
Originally posted by CharterJoe
When you guys watch $TICK are you counter trend i.e. selling @ +1000 and buying at -800 -1000. Or are you trend trading looking for higher highs in both the tick and ES and divergances?
one last thing POP......I synch up my YM and ES charts so they only show the 9:30 - 4:15 EST prices for this method...it's critical for me...
quote:
Originally posted by BruceM
Sorry POp...no stats,,but I can tell you this that it works great during consolidation periods....Lunchtime etc....but I'd be careful after 2:30 as the odds of a trending movement seem greater....
If you are researching this I wouldn't limit this to new high or low divergences...you can also check on previous 30 minute bars where one makes a new high/low but the other doesn'tquote:
Originally posted by popstocks
quote:
Originally posted by BruceM
a trade I missed: Dow breaks it's hour highs after it breaks it's lows...S&P doesn't.break it's highs..go short either market
Interesting approach, have you backtested it? If so what are the probabilities like? thx
Here's what I watch with $tick the blue line is overbought/oversold I look for neg -800 -1000 when the blue line is oversold and opposite when its at the upper end, great way to fade trends.
quote:
Originally posted by BruceM
Dt any suggestions on how to get all the GEMs from each day ( when applicable ) to a place where some of your readers will find it...?
Someone searching for ideas on the $tick for example will probably not think to look through all these daytrading posts...
Bruce - I echo your sentiment. I've been doing some research on that and there seems to be 2 things that we need to do to accomplish that. One is tagging: e.g. tag someone's post with the words $tick and ES for example. The other other is voting for the post: thumbs up/down. That way you can look at all the posts tagged with $tick in order of popularity.
It won't be available for some months but I'm working with the guys who are working on the new software for the forum and eventual I hope that those ideas will make their way in here.
Emini Day Trading /
Daily Notes /
Forecast /
Economic Events /
Search /
Terms and Conditions /
Disclaimer /
Books /
Online Books /
Site Map /
Contact /
Privacy Policy /
Links /
About /
Day Trading Forum /
Investment Calculators /
Pivot Point Calculator /
Market Profile Generator /
Fibonacci Calculator /
Mailing List /
Advertise Here /
Articles /
Financial Terms /
Brokers /
Software /
Holidays /
Stock Split Calendar /
Mortgage Calculator /
Donate
Copyright © 2004-2023, MyPivots. All rights reserved.
Copyright © 2004-2023, MyPivots. All rights reserved.

