AUGUST day trades
I have to give up posting signals every day and this is my solution.
Here is a 20day+ history and the Win/Loss record, I'm not excited about the results as usually I have found what works recently fails in the IMMEDIATE future...
Hopefully the signals shown are VALID and I havent screwed up and let
"known day results" leak into below tab.
NOTE: Short signals the rest of the week, (else the bear market is over?)
07/07 Mon 12|40 15|10 S -15 -5 (-15 points predicted, -5 actual)
07/08 Tue 10|00 13|20 Sx-19 +4 ( x = day is a loser)
07/09 Wed 10|00 14|20 S -12 -8
07/10 Thu 12|20 15|00 S -10-13
07/11 Fri 10|30 14|30 S -9 -1
07/14 Mon 12|00 14|00 L +11 +0
07/15 Tue 10|10 14|20 L +11+22
07/16 Wed 13|20 16|00 Sx-10+15
07/17 Thu 12|50 16|00 L +15+12
07/18 Fri 11|30 16|00 Lx+22 +0 (day excluded from Win/Loss)
07/21 Mon 11|10 15|10 S -22 -6
07/22 Tue 11|50 15|30 L +16 +6
07/23 Wed 13|40 16|00 L +6 +1
07/24 Thu 13|40 16|00 S -7-13
07/25 Fri 10|00 14|20 S -26 -4
07/28 Mon 10|30 12|50 S -8-11
07/29 Tue 10|50 15|00 L +17 +3
07/30 Wed 12|10 15|10 Lx+12 +0 (day excluded)
07/31 Thu 10|00 12|50 S -6 -3
08/01 Fri 10|40 16|00 Lx +7 +0
08/04 Mon 14|10 15|50 Lx+12 -4
08/05 Tue 10|10 15|40 L +14+15
08/06 Wed 11:30 15:40 S -9
08/07 Thu 12:10 16:00 S -20
08/08 Fri 10:30 15:00 S -19
08/11 Mon 11:20 15:10 S -10
08/12 Tue 10:20 13:30 L +13
Last 20 days W/L= 14/ 2 <- excluded are days < 1 point
2008/08/18 Mon 10:30 14:30 S +14
2008/08/19 Tue 11:40 16:00 Sx -1
2008/08/20 Wed 11:20 14:40 S +8
2008/08/21 Thu 12:20 16:00 L +4
2008/08/22 Fri NONE
August W/L = 5/8 Points = +17
2008/08/19 Tue 11:40 16:00 Sx -1
2008/08/20 Wed 11:20 14:40 S +8
2008/08/21 Thu 12:20 16:00 L +4
2008/08/22 Fri NONE
August W/L = 5/8 Points = +17
Do you have a graph from a spreadsheet to track the record? It is a lot easier to see (for me anyway)
quote:
Originally posted by davegemini
I have to give up posting signals every day and this is my solution.
Here is a 20day+ history and the Win/Loss record, I'm not excited about the results as usually I have found what works recently fails in the IMMEDIATE future...
Hopefully the signals shown are VALID and I havent screwed up and let
"known day results" leak into below tab.
NOTE: Short signals the rest of the week, (else the bear market is over?)
07/07 Mon 12|40 15|10 S -15 -5 (-15 points predicted, -5 actual)
07/08 Tue 10|00 13|20 Sx-19 +4 ( x = day is a loser)
07/09 Wed 10|00 14|20 S -12 -8
07/10 Thu 12|20 15|00 S -10-13
07/11 Fri 10|30 14|30 S -9 -1
07/14 Mon 12|00 14|00 L +11 +0
07/15 Tue 10|10 14|20 L +11+22
07/16 Wed 13|20 16|00 Sx-10+15
07/17 Thu 12|50 16|00 L +15+12
07/18 Fri 11|30 16|00 Lx+22 +0 (day excluded from Win/Loss)
07/21 Mon 11|10 15|10 S -22 -6
07/22 Tue 11|50 15|30 L +16 +6
07/23 Wed 13|40 16|00 L +6 +1
07/24 Thu 13|40 16|00 S -7-13
07/25 Fri 10|00 14|20 S -26 -4
07/28 Mon 10|30 12|50 S -8-11
07/29 Tue 10|50 15|00 L +17 +3
07/30 Wed 12|10 15|10 Lx+12 +0 (day excluded)
07/31 Thu 10|00 12|50 S -6 -3
08/01 Fri 10|40 16|00 Lx +7 +0
08/04 Mon 14|10 15|50 Lx+12 -4
08/05 Tue 10|10 15|40 L +14+15
08/06 Wed 11:30 15:40 S -9
08/07 Thu 12:10 16:00 S -20
08/08 Fri 10:30 15:00 S -19
08/11 Mon 11:20 15:10 S -10
08/12 Tue 10:20 13:30 L +13
Last 20 days W/L= 14/ 2 <- excluded are days < 1 point
08/25 Mon NONE
08/26 Tue 10:40 14:30 S
08/27 Wed 10:10 13:30 L
08/28 Thu NONE
08/29 Fri 10:00 15:50 S
Leo11
No, I dont have a graph from a spreadsheet, sorry..
no problem, I like the visual aid since it's easier.
fyi, today's hi,lo 10min predicts were EXACT !!
good job davegemini
g
g
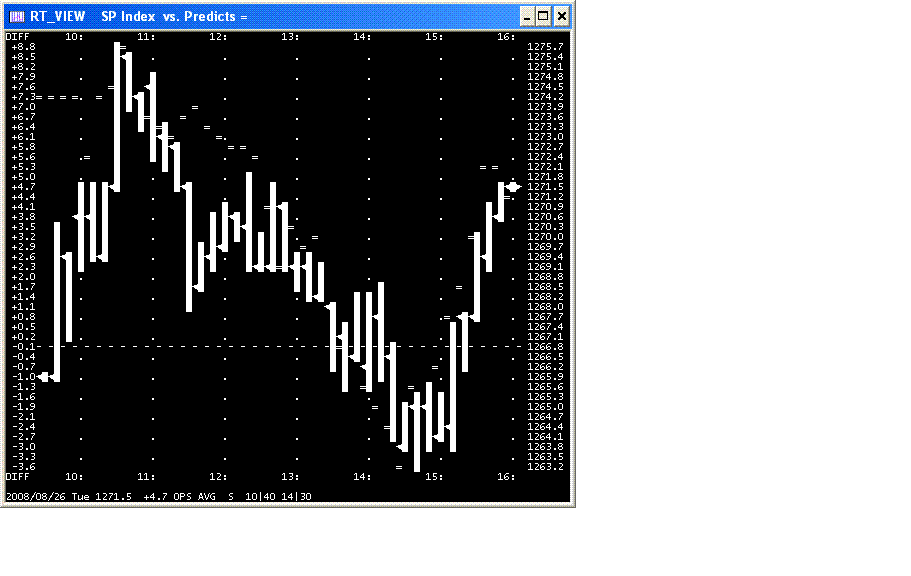
Here is a chart for 08/26 Tue,
and its rare hi,lo time predict success.
Dont expect the same success for the rest of the week.
and its rare hi,lo time predict success.
Dont expect the same success for the rest of the week.
re: "dont expect same success the rest of the week"
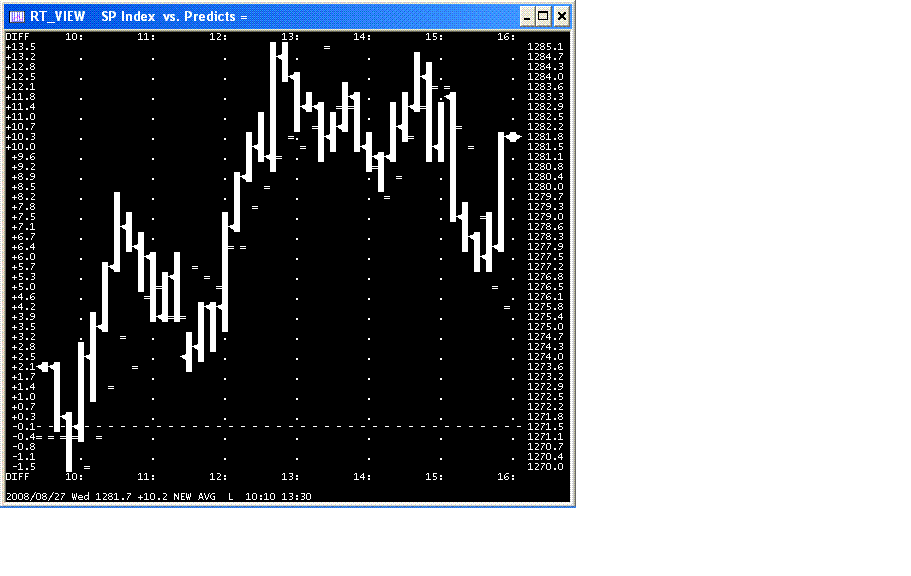
I have to share this (after the fact) chart, because it illustrates
a problem I have. Note I posted a hi time 13:30 (I let the system call it),
but that time has no neighbors confirming its the hi time. Reading the chart
a more realistic hi time was 15:10 but either way the predicts were AGAIN
RIGHT ON!!
08/25 Mon NONE
08/26 Tue 10:40 14:30 S +11 hi,lo times were exact
08/27 Wed 10:10 13:30 L +8
08/28 Thu NONE
08/29 Fri 10:00 15:50 S +10 hi,lo times were off 10min
Final August Win/Loss = 8/8 Net Points = +46
Fabulous August performance, Dave. Have a great Labor Day weekend.
List of signals for days >= +-5 points
======================================
08/05 Tue 11:30 15:40 L +11 Fed meeting day
08/06 Wed 11:30 15:40 Sx -6
08/07 Thu 12:10 16:00 S +10
08/08 Fri 10:30 15:00 Sx -9
08/18 Mon 10:30 14:30 S +14
08/20 Wed 11:20 14:40 S +8
08/26 Tue 10:40 14:30 S +11 hi,lo times were exact
08/27 Wed 10:10 13:30 L +8
08/29 Fri 10:00 15:50 S +10 hi,lo times were off 10min
Win/Loss = 7/2 Net Points = +57
I wont be posting in September, but may be back in October.
Emini Day Trading /
Daily Notes /
Forecast /
Economic Events /
Search /
Terms and Conditions /
Disclaimer /
Books /
Online Books /
Site Map /
Contact /
Privacy Policy /
Links /
About /
Day Trading Forum /
Investment Calculators /
Pivot Point Calculator /
Market Profile Generator /
Fibonacci Calculator /
Mailing List /
Advertise Here /
Articles /
Financial Terms /
Brokers /
Software /
Holidays /
Stock Split Calendar /
Mortgage Calculator /
Donate
Copyright © 2004-2023, MyPivots. All rights reserved.
Copyright © 2004-2023, MyPivots. All rights reserved.

