Larry Williams darlings - help needed!!
I may have asked this before but I'm looking for an online stock screener ( preferably free) that can help me scan for LW's darlings.
We can debate the validity/credibility of Williams at another time but here is what they are:
The Darlings are the low priced DJIA stocks that have low price to sales and low FORWARD 12 month p/e ratios
Here is what I want to do:
I want to subtract the P/S and the price to cash flow ratio from the stocks dividend yield. The stocks with the highest figures are the ones to buy but as a final filter I want to take the top 5 - 7 stocks that have the LOWEST 12 month forward p/e ratios.
Whew !! You math guys are too much.
Any help would be appreciated..
Bruce
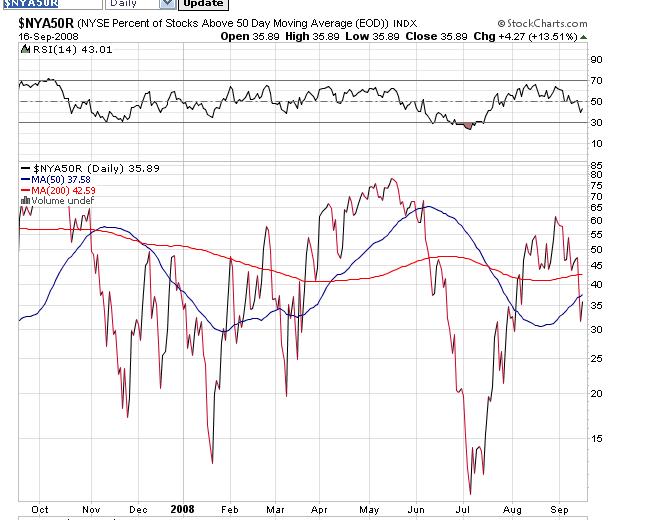
Here is a chart that shows the % of NYSE stocks above their 50 day MA.
On Monday the big down day the S&P broke it's July lows but not the Dow or Compx.....yet look at what happened to stocks above the 50 MA. They are not even close to the July lows.
So does this mean that we have had a selective decline and the strength of the remaining stocks will help lift the market OR
Does it mean that the market needs to have a broader sell off to encourage broad based buying....?
I think a broader selloff may still come.....we did have a 90% up day last week which in theory is a good sign but we need at least one more.....then I'll feel better...
It seems that high volume upthrust needs to be absorbed a bit before we go higher.....I think it will take one - two months before any significant rally can take hold...even with the "bailout". It won't be easy....
It seems that high volume upthrust needs to be absorbed a bit before we go higher.....I think it will take one - two months before any significant rally can take hold...even with the "bailout". It won't be easy....
I bought disney april 09 calls today at $3....a meager attempt to try and absorb some of this drawdown this portfolio is taking
I added CALM at 27.69 today....
I added MCD 62.5 calls at 5.50 and wmt 57.5 calls at 6.55....both expire in march 09
I added more dis calls....at 2.25..same strike and expiration.....am I bullish...? lol
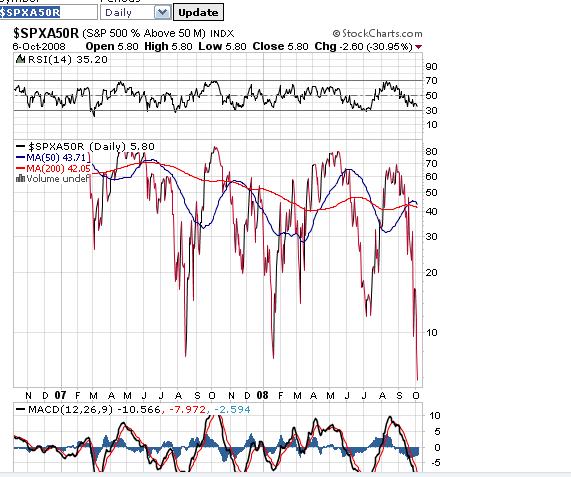
One thing Williams doesn't seem to address is the drawdown when the timing is off/late....anyway here is a chart of the % of S&P stocks above the 50 day MA....doesn't seem to be any at this time.........if this doesn't help Iron out a bottom with a Vix above 52 then we are in trouble...and so is this portfolio....Jim Kane...are we there yet?
I sold these today at 27.88...this was/is a relative strength stock and I just don't like that gap after the report it had recently.... also
quote:
Originally posted by BruceM
I added CALM at 27.69 today....
I added spy's at 85.54 today...we are down over 40% over last Octobers highs...
I sold these add ons at 105.23 on the open today
quote:
Originally posted by BruceM
I added spy's at 85.54 today...we are down over 40% over last Octobers highs...
Thank you, Bruce!
Emini Day Trading /
Daily Notes /
Forecast /
Economic Events /
Search /
Terms and Conditions /
Disclaimer /
Books /
Online Books /
Site Map /
Contact /
Privacy Policy /
Links /
About /
Day Trading Forum /
Investment Calculators /
Pivot Point Calculator /
Market Profile Generator /
Fibonacci Calculator /
Mailing List /
Advertise Here /
Articles /
Financial Terms /
Brokers /
Software /
Holidays /
Stock Split Calendar /
Mortgage Calculator /
Donate
Copyright © 2004-2023, MyPivots. All rights reserved.
Copyright © 2004-2023, MyPivots. All rights reserved.

