Future US House Prices
[Originally posted on Monday, July 17, 2006 9:50 PM]
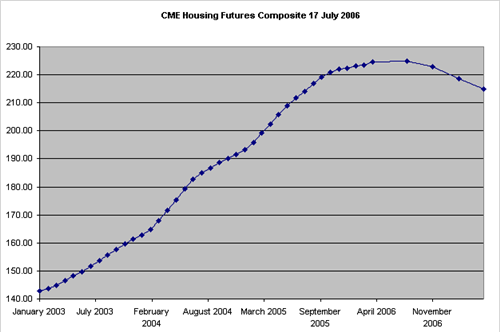
Today (17 July 2006) I did an update of CME's Housing Future and took a look at the composite index and what direction it is indicating. i.e. Are the futures priced in contango or backwardation? Contango means that the futures prices are above the current prices and backwardation the opposite.
This chart tells it all and there is very little room for further comment. The close spaced dots represent historic index values for the composite (i.e. all 10 areas combined in a weighted index) house price. The last 4 more widely spread prices that are dropping off show the futures prices in 3 month increments for the next 4 delivery months or 1 year.
I have taken data starting in January 2003 through to May 2007; a blend of historic and futures data. This data is plotted on an XY chart. This means that the time scale on the X axis is representative of actual time and this is why the 5 data points on the right of the chart are 3 times wider apart than the previous data points; the futures represent prices in quarter increments and the historic in monthly increments.
Don't Panic - By mathers on Tuesday, July 18, 2006 12:54 PM
I was watching a realtor's video on a web the other day and he said "sellers please don't go from greed to fear, please don't lower your house price in a panic" which i thought was interesting. From that I understand that the Realtors realize that if the house prices drop then their business will be down the drain and that's why they are trying to convince house sellers to keep the prices high and so long as sellers stay together and none of them give into the "lower price syndrome" then they will force buyers to accept higher prices. This is a sort of sellers cartel - and a perfectly legal one as well. If all sellers agree not to lower prices, and none of them do, then buyers will have no choice.
The problem comes when you have house investors as opposed to home owners. These are flippers turning a fast buck. I saw a house the other day that was bought in mid 2005 for 550. The investor put 100 into it in remodelling and so is sitting on a cost of 650. He put it on the market in December for 750. He took it off the market and then re-listed it. Now seven months later it is now priced at 715 and still no interest.
Another interesting anecdote came from someone who work for a home builder and said that their office managed to sell 50 new units that month. (I think she was referring to the month of May 2006.) However, she said, the big problem was that they had 51 cancellations from previous new home sales during the same month so at the end of the month they ended up with a net 1 extra new house on the books after all those sales.
By day trading on Tuesday, August 15, 2006 6:45 PM
US Housing Index Falls In August
The National Association of Home Builders' index for U.S. sales of new, single-family homes fell in August to 32, its lowest point since February 1991 when the economy was in recession.
The housing market index, compiled by the NAHB and Wells Fargo, was down seven points from July's unrevised level of 39. August was the seventh straight month of declining builder confidence, as gauged by the index.
"It's important to recognize that home sales and housing production are subsiding from record levels a year ago, and those levels clearly were unsustainable," said NAHB Chief Economist David Seiders. "We expect the erosion in market activity to continue through most of this year before stabilizing in 2007."
Builder sentiment tends to contract more than actual sales and production, Seiders said. For their part, buyers should be optimistic about the market, he said, citing a healthy economy, historically low interest rates, slowing price appreciation and builders' sales incentives.
Emini Day Trading /
Daily Notes /
Forecast /
Economic Events /
Search /
Terms and Conditions /
Disclaimer /
Books /
Online Books /
Site Map /
Contact /
Privacy Policy /
Links /
About /
Day Trading Forum /
Investment Calculators /
Pivot Point Calculator /
Market Profile Generator /
Fibonacci Calculator /
Mailing List /
Advertise Here /
Articles /
Financial Terms /
Brokers /
Software /
Holidays /
Stock Split Calendar /
Mortgage Calculator /
Donate
Copyright © 2004-2023, MyPivots. All rights reserved.
Copyright © 2004-2023, MyPivots. All rights reserved.
