Multi - day profiles
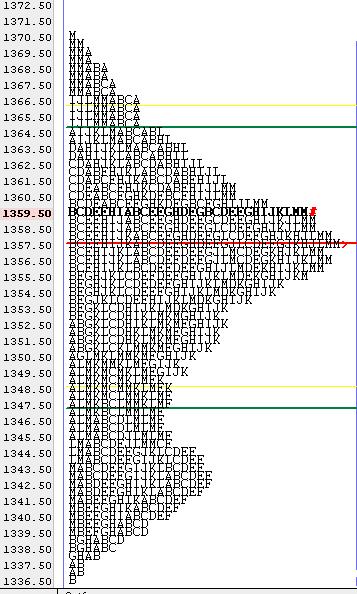
Eventually I'd like to kick off a discussion on multi - day profiles....for now here is a composite of the ES that formed during that recent consolidation that began on February 6th....Currently the Es is hitting against the 1357 area as I type in the overnight session. It will be interesting to see what happens from here.
My guess is that the long side is going to take hold but please make any comment you care to. I know some use a fixed amount of days and others will use ranges......I'd like this thread to eventual fiqure out what would be more practical. My hunch is that using a fixed time will NOT be the best way to go but I'm certainly no expert....
My guess is that the long side is going to take hold but please make any comment you care to. I know some use a fixed amount of days and others will use ranges......I'd like this thread to eventual fiqure out what would be more practical. My hunch is that using a fixed time will NOT be the best way to go but I'm certainly no expert....
while I didn't trade off of this I still find it interesting that the market found resistence ( after opening at 1353.50 ) at the "buldge" at the 55 - 59 area ( current daily high is 1354.75) and currently the daily low is down at 40.75....which is close to the "buldge" at the 42.50 area......does this mean we will back and fill for the rest of today....? I don't know....just making an observation......
Bruce
Bruce
The chart below is 2nd Friday in aug completing the IB for the monthly profile.
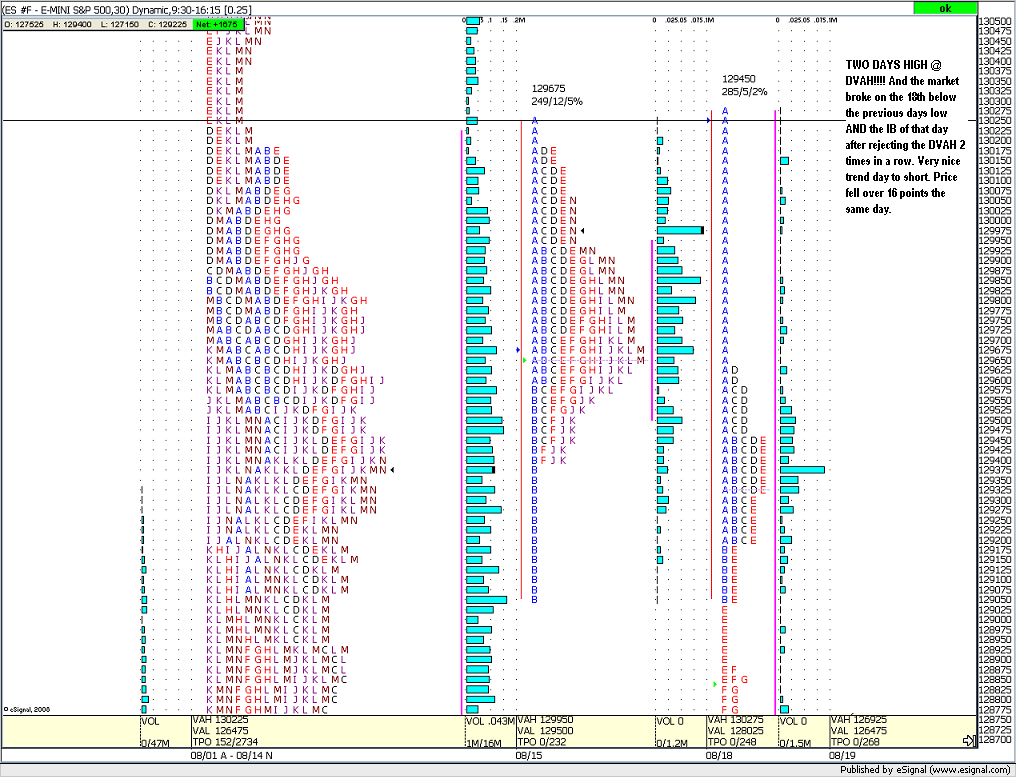
The 13th basicly traded within the monthly value with a range extension on both ends...
The 14th was a trend day with the high being only a few ticks from the monthly DVAH level.
The 13th basicly traded within the monthly value with a range extension on both ends...
The 14th was a trend day with the high being only a few ticks from the monthly DVAH level.
The 19th markets opened right @ the monthly DVAL and struggled all day to break it, it was a normal varition day. With 2 range extensions....
The 20th was the same a normal varition day with a couple range extensions to the upside and then fell back out of the Monthly VA but maneged a close withing value.
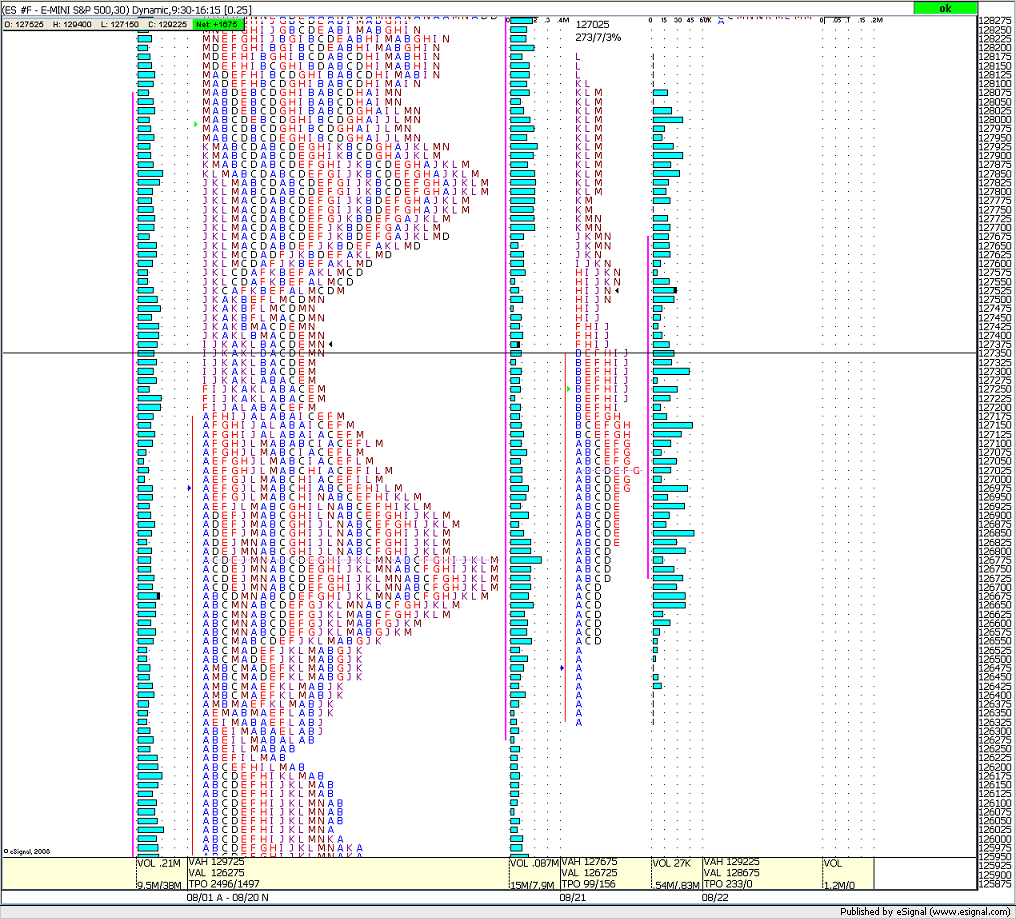
The 21st ES opened at the Monthly VAL,and didn't trade below it, made 6 range extension to the upside after the IB breakout (daily IB)
The 23 (friday) we had the DVAH @ 96.75 so I think that had we had any follow through to the upside would have been met with some possible selling.
Any way a very interesting tatic to daytrading i.e. with DVA. I also went back thru July and June and came up with good results.
One more thing about this week is very intersting how the ES tested the VAL on wends and then shot back up to the upper end of value exactly like a daily DVAH to DVAL does. Thats over 30.00 points in a couple of days and MP called it to the tick.
well done Joe...I think we may have a new MP expert on the forum.....I'm hoping to have more time with your charts
on Wednesday or Thursday...thanks
on Wednesday or Thursday...thanks
Typo correction in the last post...When I said markets traded above and below this weeks IB I ment above and below this weeks DVAH inside todays IB.
Also something else I noticed on this last chart I posted, Bruce, is how the market just eats through the low volume areas and stales at the price's with high volume....Any way thanks for turning me on MP. Monthly and weekly MP is the best thing I have ever seen, it gives me a longer term fell for the market.
Joe, you had mentioned that on the weekly profile you used a 2 day IB. How long is each time period? I know that on a daily profile you use a 30min period but what do you use for a weekly/monthly profile?
daily IB = 60 miin
weekly IB = 2 days
monthly IB = 5days
Quartly IB = 1 month
I got these figures from the cbot handbook I believe, and have backtested them on the ES and they are very accurate.
weekly IB = 2 days
monthly IB = 5days
Quartly IB = 1 month
I got these figures from the cbot handbook I believe, and have backtested them on the ES and they are very accurate.
BUMP for bruce....
Are these what you were talking about? The number one thing I look for is a penetration in the IB within the first hour not after (thats the A and B has to break the resistance or support) and then a break in that direction. Like the first chart the IB broke 3 weeks VAL's and then broke the IB and tanked 40 points, I remember that trade.
Are these what you were talking about? The number one thing I look for is a penetration in the IB within the first hour not after (thats the A and B has to break the resistance or support) and then a break in that direction. Like the first chart the IB broke 3 weeks VAL's and then broke the IB and tanked 40 points, I remember that trade.
Emini Day Trading /
Daily Notes /
Forecast /
Economic Events /
Search /
Terms and Conditions /
Disclaimer /
Books /
Online Books /
Site Map /
Contact /
Privacy Policy /
Links /
About /
Day Trading Forum /
Investment Calculators /
Pivot Point Calculator /
Market Profile Generator /
Fibonacci Calculator /
Mailing List /
Advertise Here /
Articles /
Financial Terms /
Brokers /
Software /
Holidays /
Stock Split Calendar /
Mortgage Calculator /
Donate
Copyright © 2004-2023, MyPivots. All rights reserved.
Copyright © 2004-2023, MyPivots. All rights reserved.


