The Markets - 10 years to end of 2007
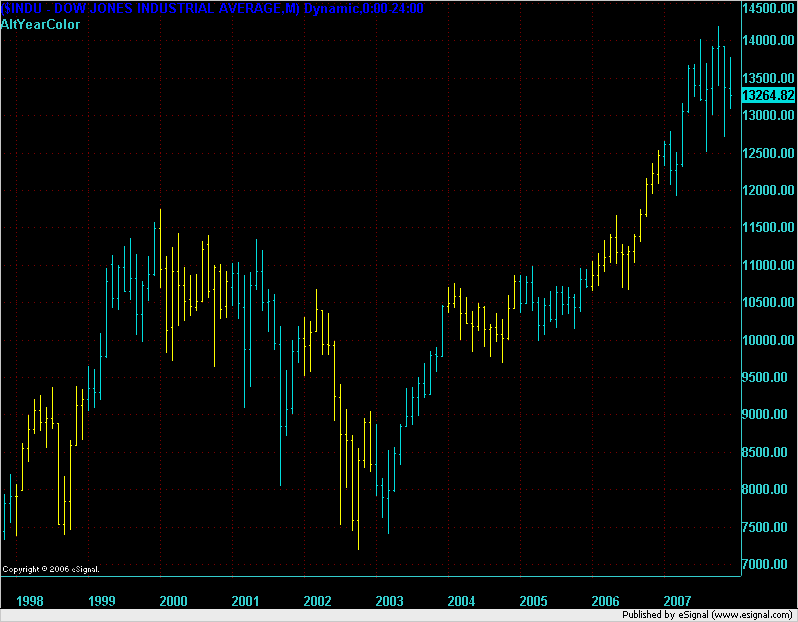
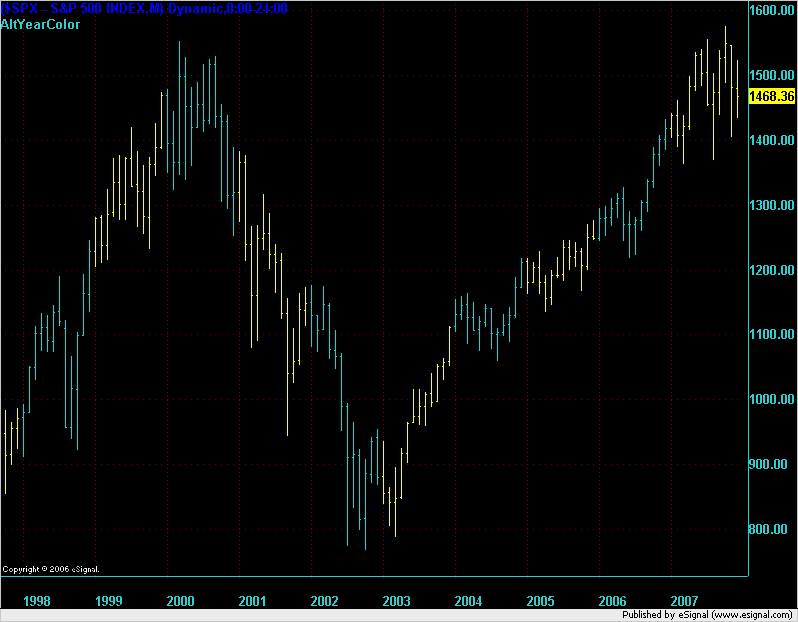
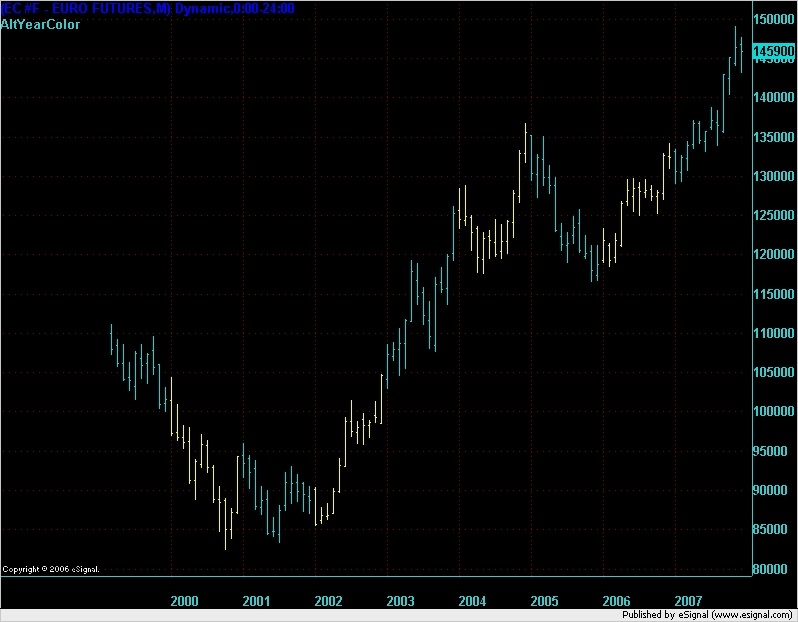
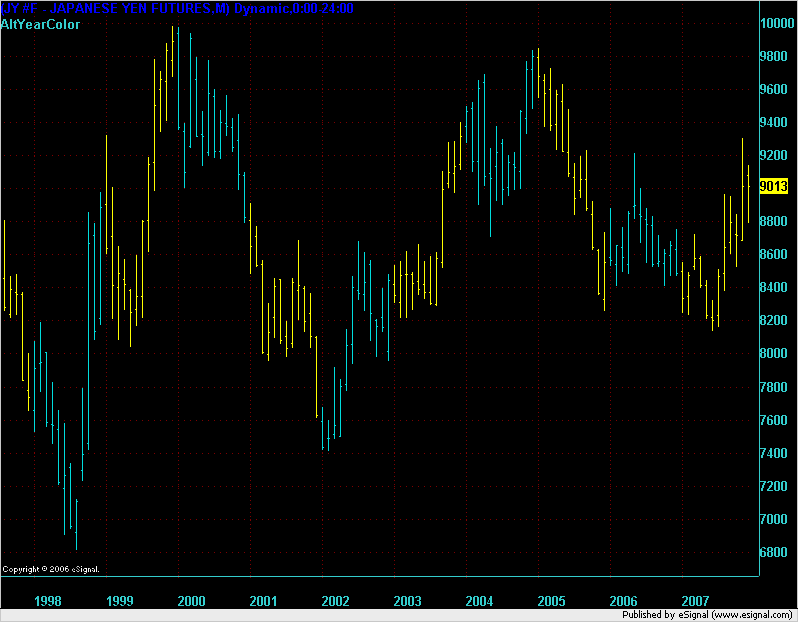
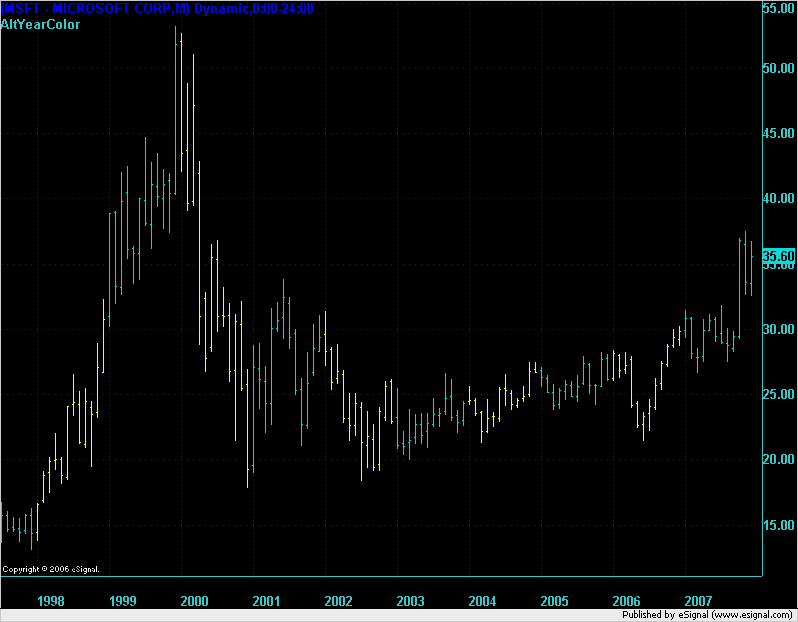
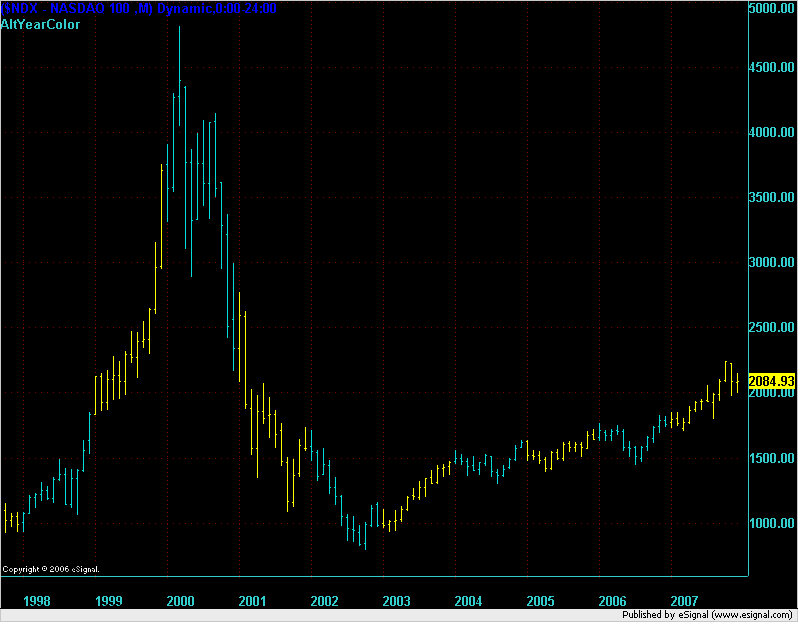
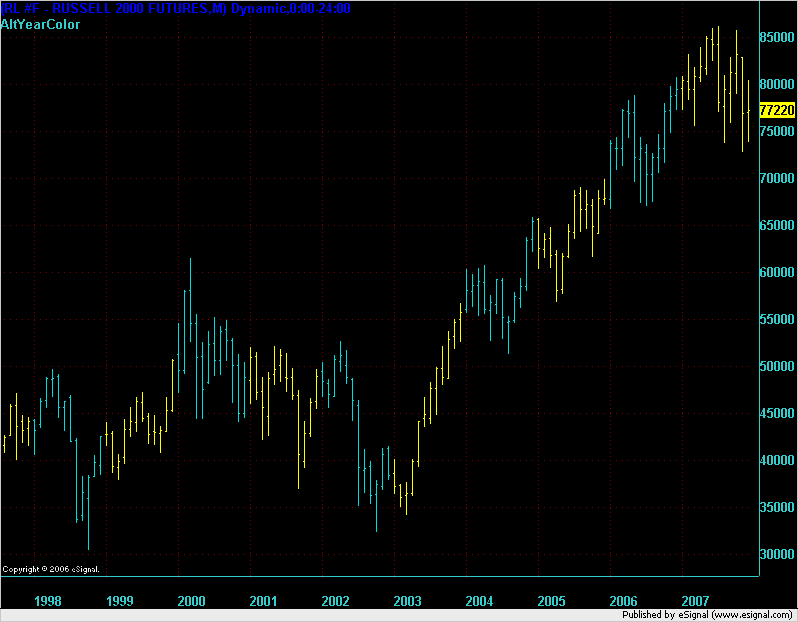
I thought that I would post some charts showing the markets over the last ten years through to the end of 2007. If you have any similar charts then please feel free to post them as replies to this topic. These are monthly charts and the color changes each year to try and give the chart more distinction.
Over the last 10 years to the end of 2007: S&P500, Euro, Japanese Yen, Microsoft, Nasdaq, Russell 2000.
Emini Day Trading /
Daily Notes /
Forecast /
Economic Events /
Search /
Terms and Conditions /
Disclaimer /
Books /
Online Books /
Site Map /
Contact /
Privacy Policy /
Links /
About /
Day Trading Forum /
Investment Calculators /
Pivot Point Calculator /
Market Profile Generator /
Fibonacci Calculator /
Mailing List /
Advertise Here /
Articles /
Financial Terms /
Brokers /
Software /
Holidays /
Stock Split Calendar /
Mortgage Calculator /
Donate
Copyright © 2004-2023, MyPivots. All rights reserved.
Copyright © 2004-2023, MyPivots. All rights reserved.
