The Ichimoku Dragon Pattern
The following provided by gio5959:
The Ichimoku Dragon Pattern
First , let me say that I was not the one who first spotted this pattern using the Ichi and if could remember where I first saw it mentioned I would gladly give that person the credit
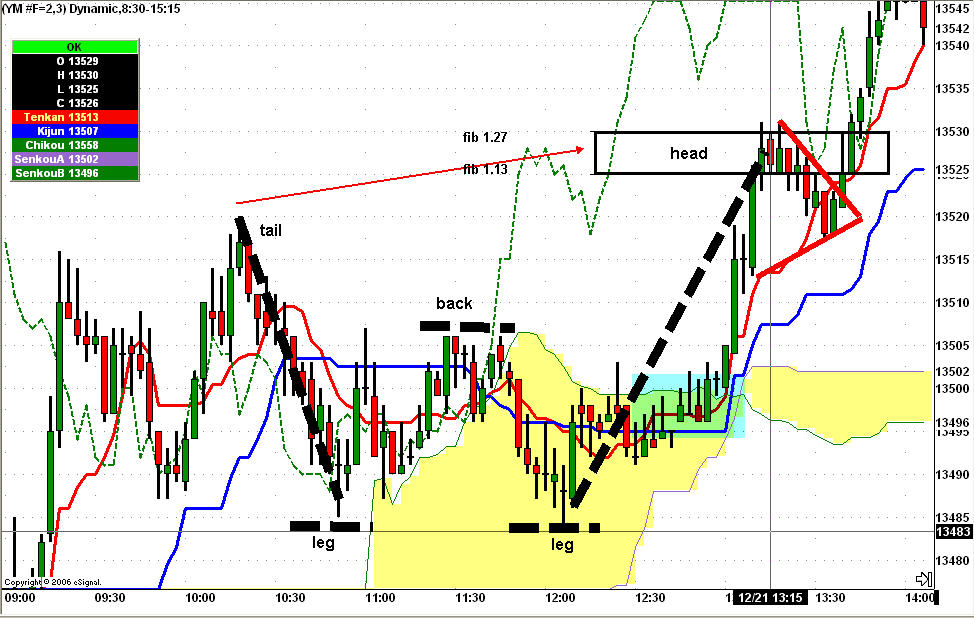
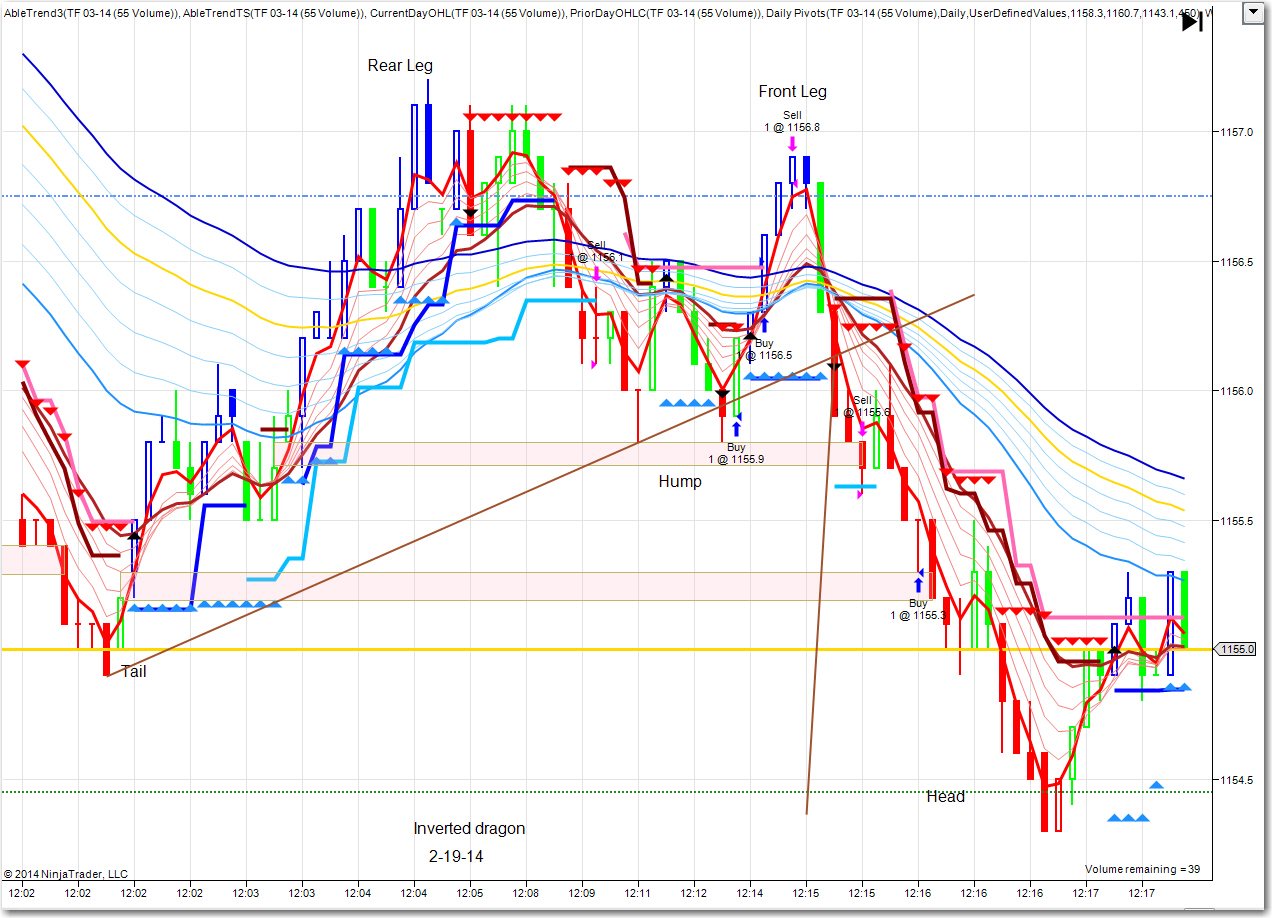
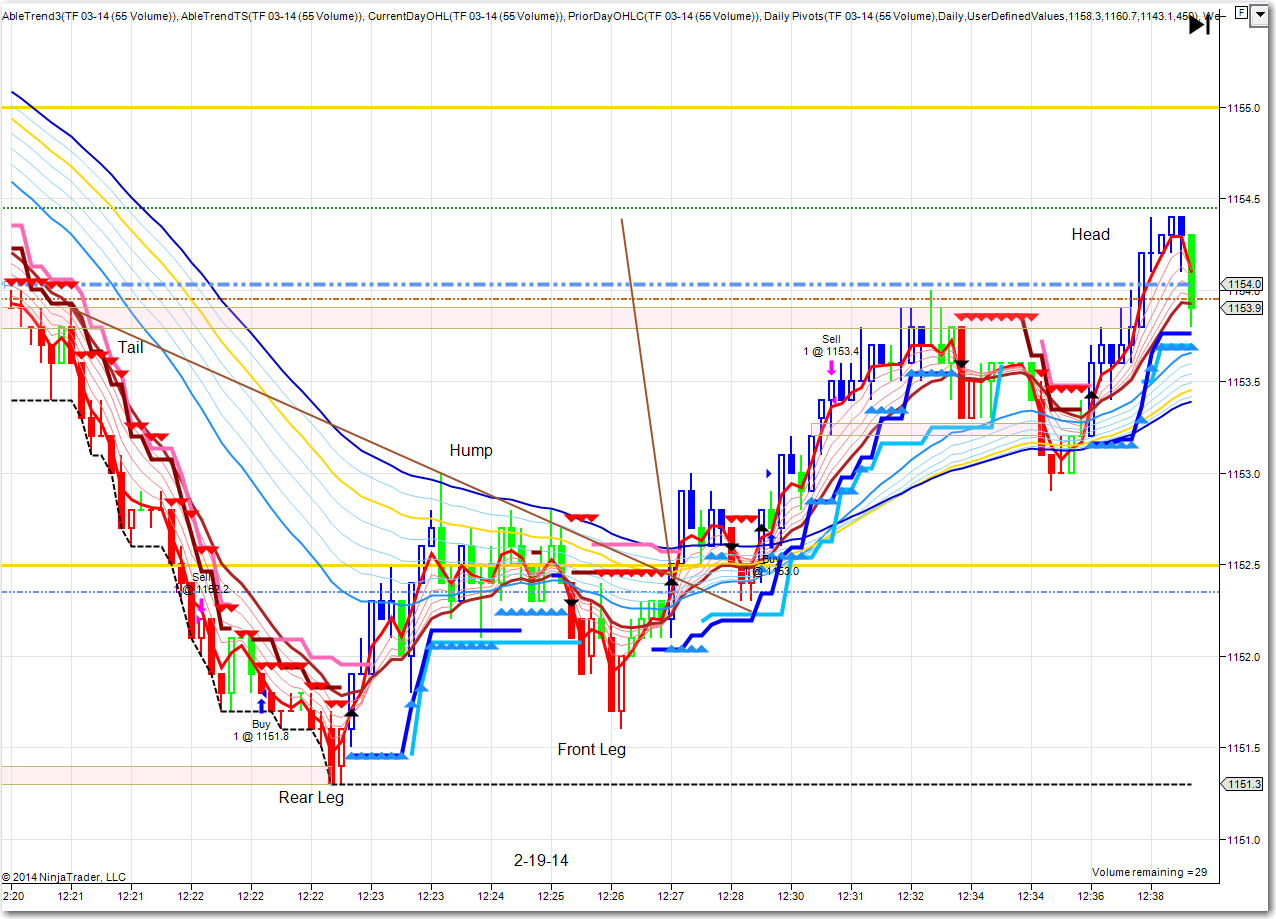
Nonetheless, this pattern is merely a W pattern or can be a M pattern if turned upside down. This pattern can happen in all time frames. What it attempts to do is identify a short term reversal in the trend (or, what I like to call a 'shock and awe').
The tail will usually, but not always, be a high of the day and then makes a double bottom where it creates the legs. The back part of the pattern tends to retrace and test the bottom of the tail-hook (support/resistance).
After the second leg is in place (double bottom) you might anticipate the breakout of the back.
Now, what I've noticed is that when the 'Ichi' gives a buy sig (a cross of the Tenkan Sen and Kijun Sen) as outlined in light blue color, after the legs are formed (double bottom) the price tends to go to fib levels 1.13/ fib 1.27 from the HOD and LOD where it forms the head of the Dragon. (whew, that was a long sentence)
One more thing to consider is - If the bottom of the head does not come down and violate the top of the tail or go as low as the back of the pattern we may then have a continuation of price. (the Dragon rears it head and breathes fire). If price does come back down to violate the tail or back part of the pattern then Tarragon the Dragon Slayer has killed the Dragon and no continuation of price - okay, I had fun with that analogy :)
This happens to be a 3min chart but if a trader would use BruceM's 'triple bar theory' in a 5min chart you will notice something very special in the formation of this pattern.
Good luck and I hope this 'very simple chart pattern' helps in your trading. The Ichi just makes it easier to spot and therefore plan your trade and may even provide some humor and thus relieve some stress while trading.
Howdy,
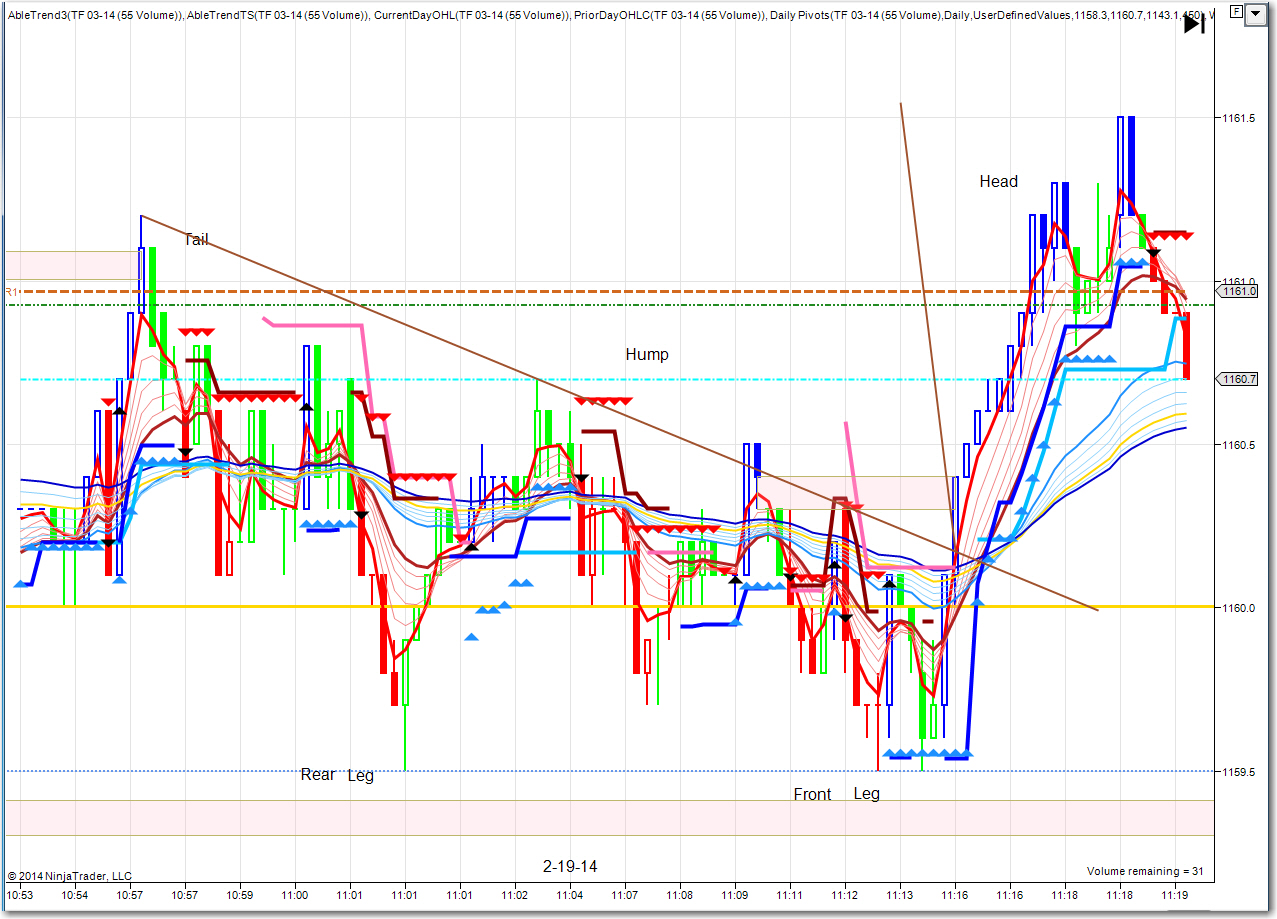
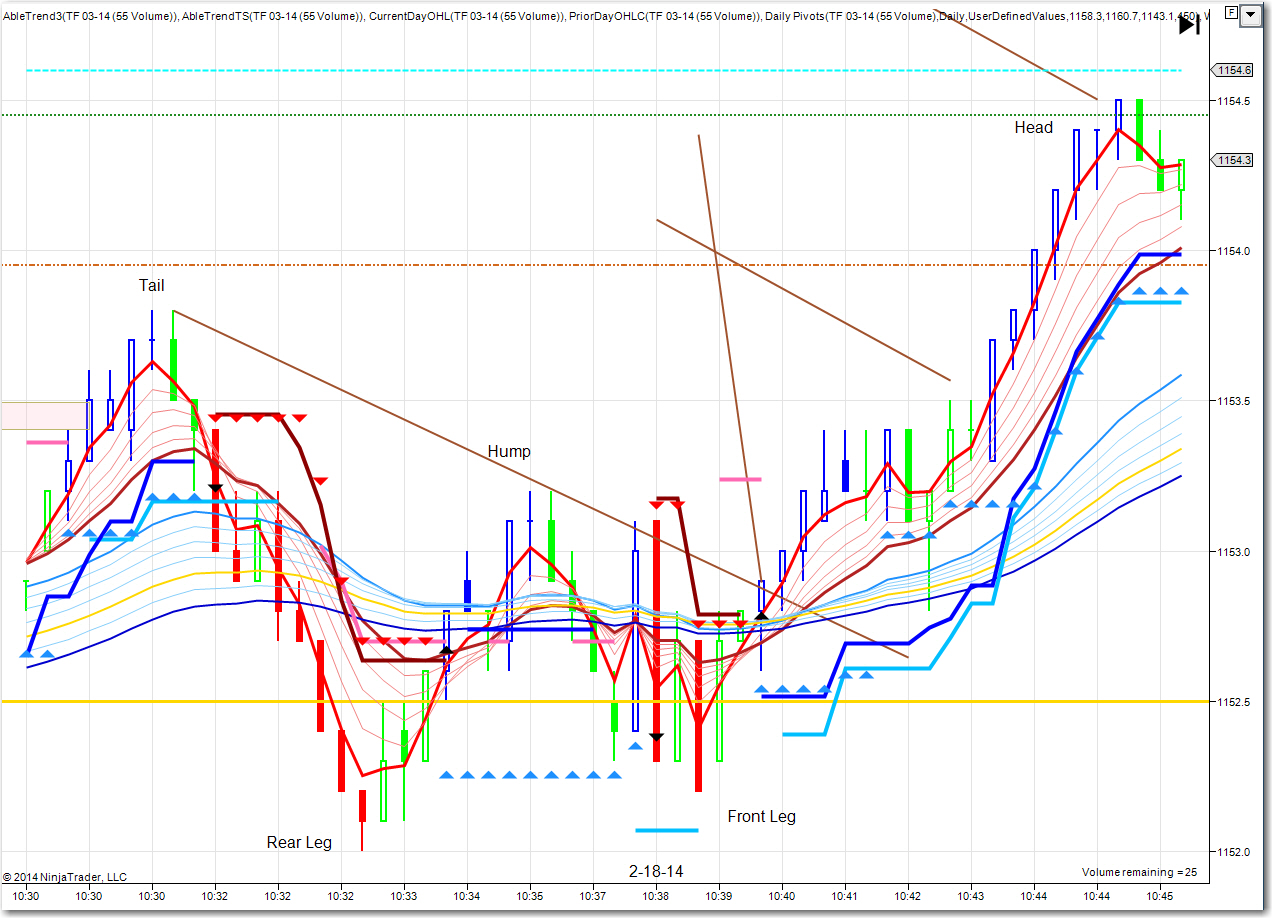
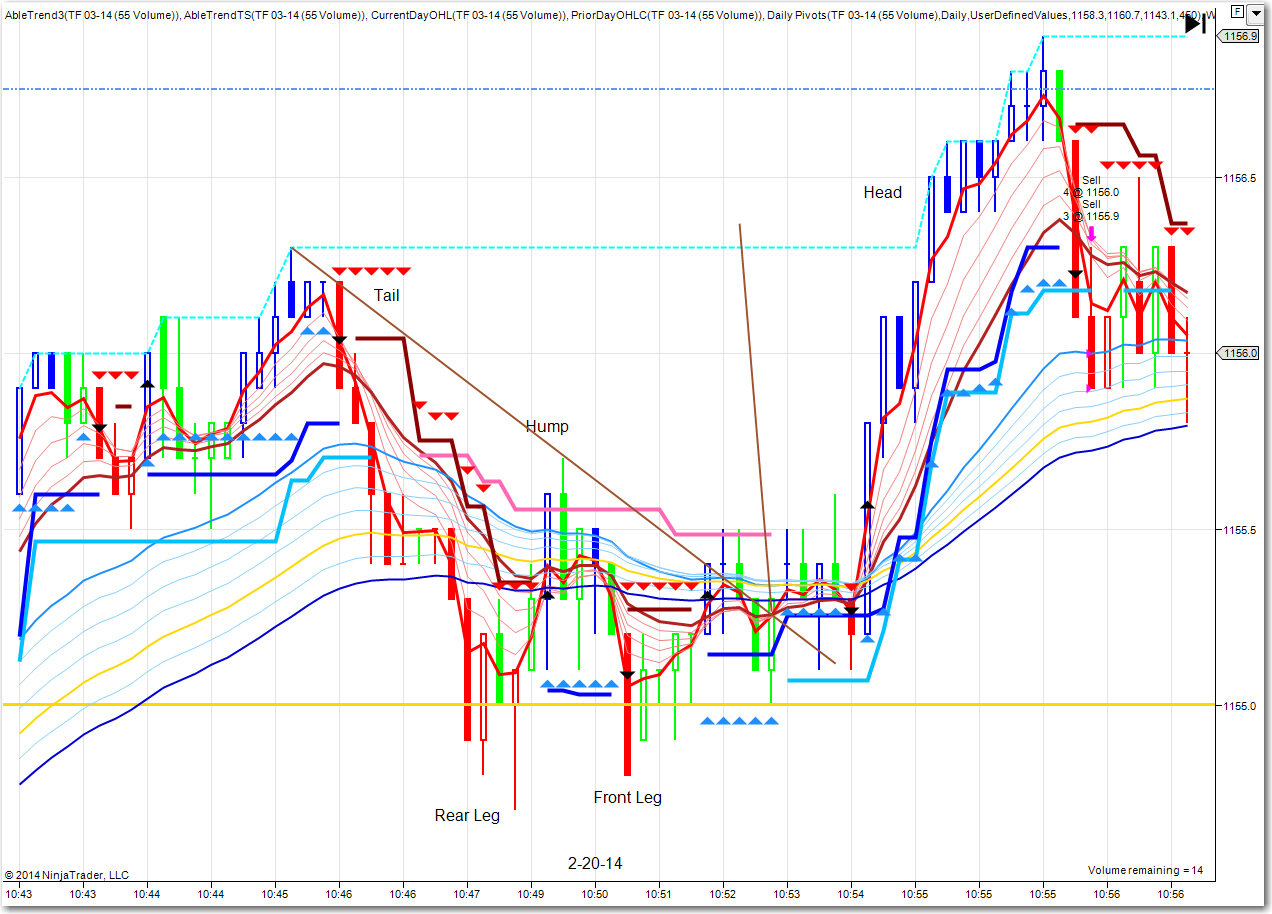
Here is another Dragon from today 2-19-14. If you notice there has been one quiet frequently around the same time everyday.
Here is another Dragon from today 2-19-14. If you notice there has been one quiet frequently around the same time everyday.
Emini Day Trading /
Daily Notes /
Forecast /
Economic Events /
Search /
Terms and Conditions /
Disclaimer /
Books /
Online Books /
Site Map /
Contact /
Privacy Policy /
Links /
About /
Day Trading Forum /
Investment Calculators /
Pivot Point Calculator /
Market Profile Generator /
Fibonacci Calculator /
Mailing List /
Advertise Here /
Articles /
Financial Terms /
Brokers /
Software /
Holidays /
Stock Split Calendar /
Mortgage Calculator /
Donate
Copyright © 2004-2023, MyPivots. All rights reserved.
Copyright © 2004-2023, MyPivots. All rights reserved.
