lots of numbers?
Seem to be in this 1486 - 1491 area...a rally in overnight into this zone.......is everyone really believing the hype of the rate cut etc........crazy world..well my thoughts are to downside but I know what that got me on Wednesday...I see Market profile numbers , pivots from daily and weekly...
This is called "justifying a position" and can be dangerous to your wealth...
This is called "justifying a position" and can be dangerous to your wealth...
Thanks..79.50 is my final fill.....no ammo ( contracts)left so I'll sit aside..seems like they may go to get those foks waiting at 1475
quote:
Originally posted by pt_emini
nice little short there Bruce !
you gonna let some run with it ?
That 85 break was nice but just what in the chart did anyone see to suggest the break had legs to downside?
I looked at the following to come up with that zone...
we had the weekly R2 at 1490
we had the daily R2 at 1486
We hit the full weekly projection to the upside
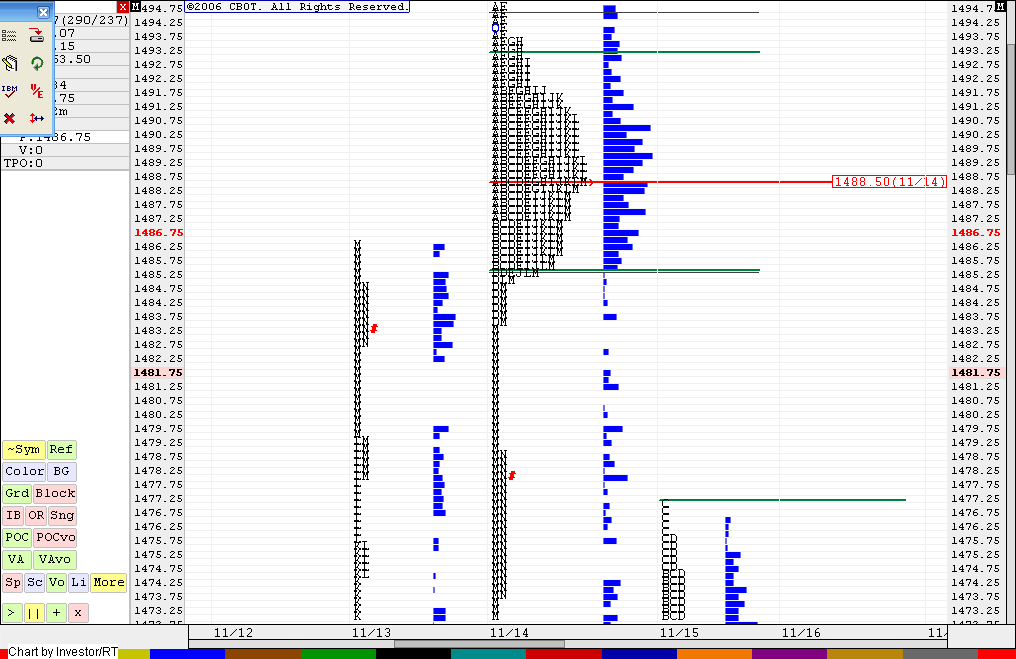
And VERY, VERY important to me was this: I don't usually post my MP charts so don't worry , I'm not going to make it a habit. Look this distribution form November 14th with the high volume node at the 1488 area....lots of buying and selling going on in that zone on that day..
For reference I covered my last contract right after we traded the full distance of the IB subtracted from the break of the hour lows... some may have projected using the triangle that Pt-Emini pointed out...it's all good.
Here is my chart from the 14th...
This isn't meant to be a wise ass remark but it was the actual lack of upside potential that kept me short.
I think another answer is that none of us ever truely know which way the market will go or for how far. The use of extra contracts helps to catch bigger moves.....sorry I can't be more specific.
Bruce
I think another answer is that none of us ever truely know which way the market will go or for how far. The use of extra contracts helps to catch bigger moves.....sorry I can't be more specific.
Bruce
quote:
Originally posted by msc
That 85 break was nice but just what in the chart did anyone see to suggest the break had legs to downside?
quote:
Originally posted by msc
That 85 break was nice but just what in the chart did anyone see to suggest the break had legs to downside?
The honest answer is we never know for sure. Sometimes the market will sweep stops below a pattern like that, and then reverse sharply back through the consolidation area (in this case back up through 85). Forming a failed breakout, which in and of itself is a very powerful pattern. A good reason to keep a tight stop on the new trade.
We did mention the weakness in the NQ, which was a signal the early market price action was not 100% in gear for a gap and run scenario (like Wednesday). This combined with the unusual size of the gap (18 points in the ES) added some incentive for the break of 85 to have some legs, it certainly had plenty of room to run. Also, many of those fortunate traders holding longs overnight are not going to be willing to give back much of that 18 points of profit the gap represents before booking some profits. Considering the time it took for the little triangle to form up at the 85 level, it is reasonable to assume sell stops were being pulled up pretty tightly below the obvious trend failure level.
The natural targets in the ES below 85 were 82 from the overnight chart and then the gap fill below that, we mentioned the gap fill (18 ES points of potential) in the pre-market discussion and we pointed out the 82 level as the 85 level was being repeatedly tested while the triangle formed up...
quote:
Originally posted by BruceM
Thanks..79.50 is my final fill.....no ammo ( contracts)left so I'll sit aside..seems like they may go to get those foks waiting at 1475
Nicely done !
...looks like the NQ and ER2 found support back in yesterday's range and won't let the ES get all the way back to 75... this keeps the 60 minute chart trend intact.
overnight triples sit at 75 even...i'm just watching
Emini Day Trading /
Daily Notes /
Forecast /
Economic Events /
Search /
Terms and Conditions /
Disclaimer /
Books /
Online Books /
Site Map /
Contact /
Privacy Policy /
Links /
About /
Day Trading Forum /
Investment Calculators /
Pivot Point Calculator /
Market Profile Generator /
Fibonacci Calculator /
Mailing List /
Advertise Here /
Articles /
Financial Terms /
Brokers /
Software /
Holidays /
Stock Split Calendar /
Mortgage Calculator /
Donate
Copyright © 2004-2023, MyPivots. All rights reserved.
Copyright © 2004-2023, MyPivots. All rights reserved.
