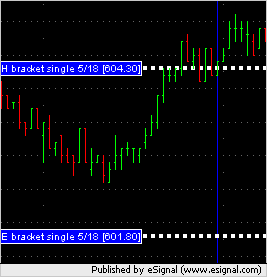
eSignal Market Profile discrepancies
I'm going to use this topic to log discrepancies between eSignal's Market Profile chart and the data/singles that are generated by the DVATool. This is part of my software testing and debugging procedure. If a user questions the differences between (say) the DVATool and the data that they see on eSignal's Market Profile then this is a good point to have a look at examples which may show the differences and why they differ. In a separate topic, eSignal have confirmed this to be a problem for some users (such as myself) and are looking into the problem.
This blue vertical line on the bar chart is the last bar in the H bracket.
This blue vertical line on the bar chart is the last bar in the H bracket.
Good news from eSignal is that they believe that the bug may be gone in Build 726 or later of eSignal when it is released. I haven't been given a release date yet but Build 724 is coming out in next few days and it will be the release after that. Here is the thread that I read the above information in:
http://forum.esignalcentral.com/showthread.php?s=&threadid=14042
http://forum.esignalcentral.com/showthread.php?s=&threadid=14042
Emini Day Trading /
Daily Notes /
Forecast /
Economic Events /
Search /
Terms and Conditions /
Disclaimer /
Books /
Online Books /
Site Map /
Contact /
Privacy Policy /
Links /
About /
Day Trading Forum /
Investment Calculators /
Pivot Point Calculator /
Market Profile Generator /
Fibonacci Calculator /
Mailing List /
Advertise Here /
Articles /
Financial Terms /
Brokers /
Software /
Holidays /
Stock Split Calendar /
Mortgage Calculator /
Donate
Copyright © 2004-2023, MyPivots. All rights reserved.
Copyright © 2004-2023, MyPivots. All rights reserved.

