Need Help Brainstorming
I am a stock trader and have been working on a system based on moving averages. I understand that no system works 100% of the time, but I want to be trading it when it is on a winning streak. So I created a two-level system. In the first level, I execute every trade the technical indicators are telling me. In the second level, I draw an equity curve and execute trades only when the curve is above a moving average.
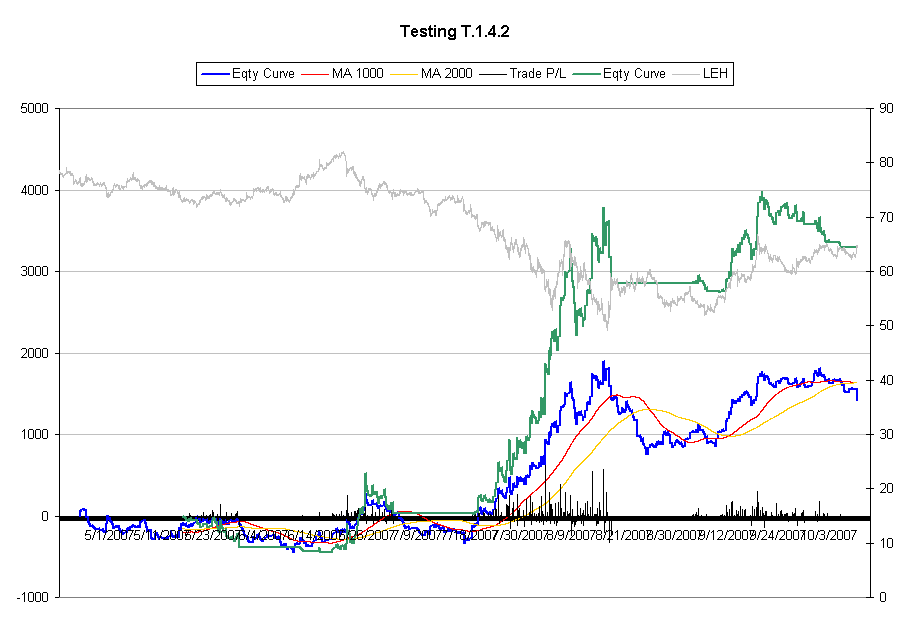
For example, in LEH, the blue line is the level-one equity curve. I trade only when it goes above the orange line. Then when it goes above the red line, I double up. The green line is the level-two equity curve.
I was expecting that the program to capture the phenomenon of sector rotation and that it will keep me in stocks that are moving. It may make money in -- for example -- ABC in April. Then I go into XYZ in May and June. Then in July I go back to ABC when is it on a winning streak. However, winners has been elusive:
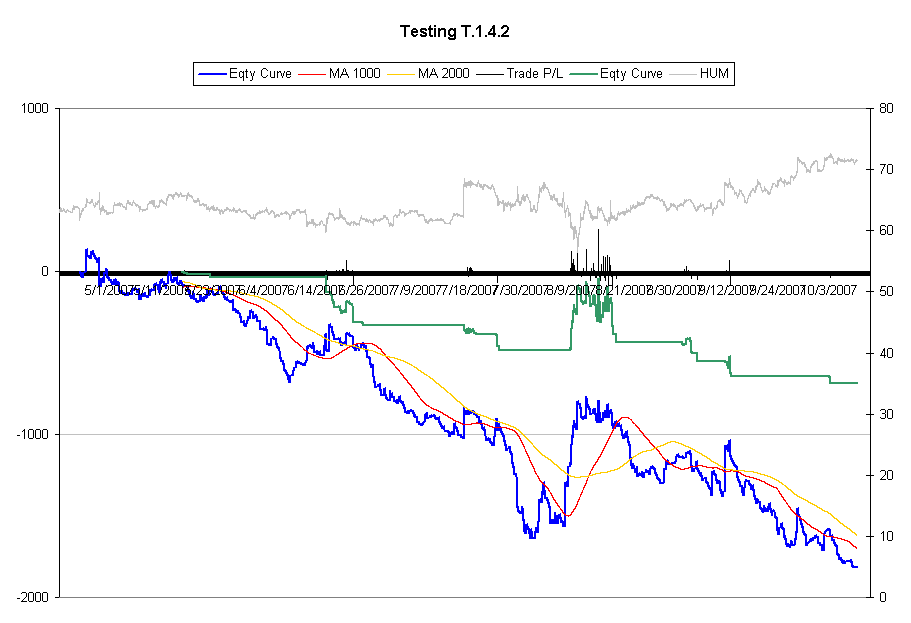
Problem 1: The level-one indicators never make money in certain stocks, like HUM.
Problem 2: Currently I am experimenting with various short-term and long-term moving averages. Perhaps one stock works better in one version while another works better with another version. Is it advisable to simultaneously use two versions?
Problem 3: Some equity curves, like stock prices, are choppy. Is there another way to capture winning streaks?
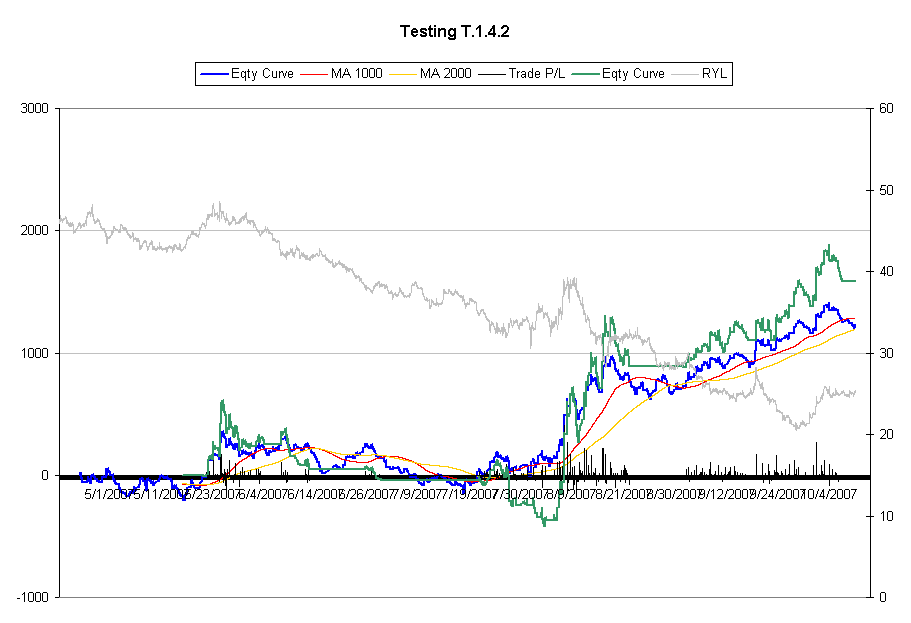
Problem 4: Many stocks did well during the subprime slime. But since then there are only a couple of winners, like RYL.
Problem 5: I have only five months of intraday data and I may run into the glove-fitting problem.
I am running out of ideas. Please help as this is my first attempt in writing a trading program. Thanks.
moving averages imply trend following, in which case you might want to look at relative strength to screen your candidates
For stocks in an uptrend, select names that are close to new highs and that show clear signs of price strength relative to the underlying index, especially when the overall market indices are weak. when the indices start to recover, these candidates should outperform on the next leg up. (inverse for a stocks in downtrend).
the idea is to get a manageable list of names that have a high probability setup forming, then enter when the setup is confirmed by price action.
Emini Day Trading /
Daily Notes /
Forecast /
Economic Events /
Search /
Terms and Conditions /
Disclaimer /
Books /
Online Books /
Site Map /
Contact /
Privacy Policy /
Links /
About /
Day Trading Forum /
Investment Calculators /
Pivot Point Calculator /
Market Profile Generator /
Fibonacci Calculator /
Mailing List /
Advertise Here /
Articles /
Financial Terms /
Brokers /
Software /
Holidays /
Stock Split Calendar /
Mortgage Calculator /
Donate
Copyright © 2004-2023, MyPivots. All rights reserved.
Copyright © 2004-2023, MyPivots. All rights reserved.


