Looking for shorts..
down to 1465 and 1456 this week...perhaps monday.....
key points from these last trades:
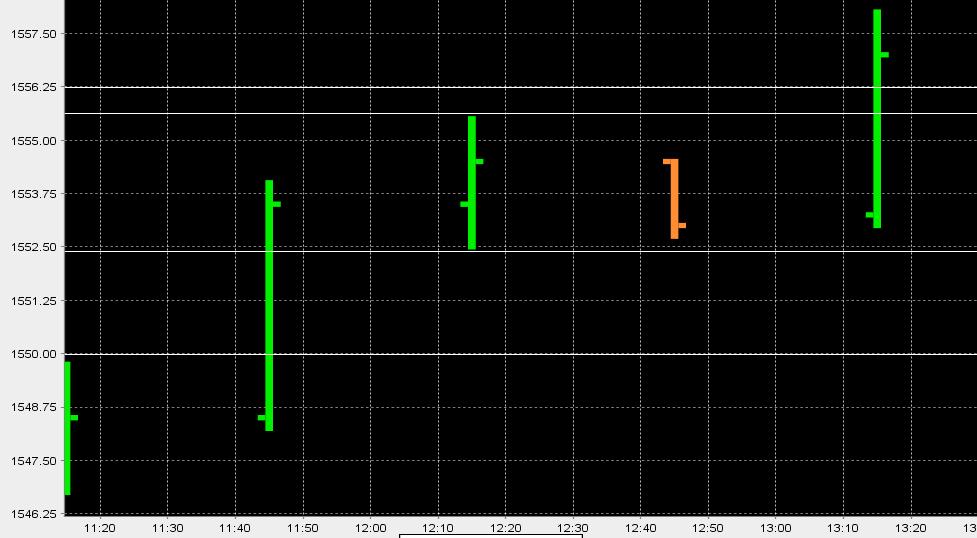
1)I try and trade for retests of "single prints" . Search the forum for a far better description then I could ever give..these came in at 1549.75 - 1552.50 area from Mondays trade. The market opened higher after a big run up day..so a magnet to the previous close is a good idea
2)I try and figure out which side of overnight high or low will be run out first and use for targets
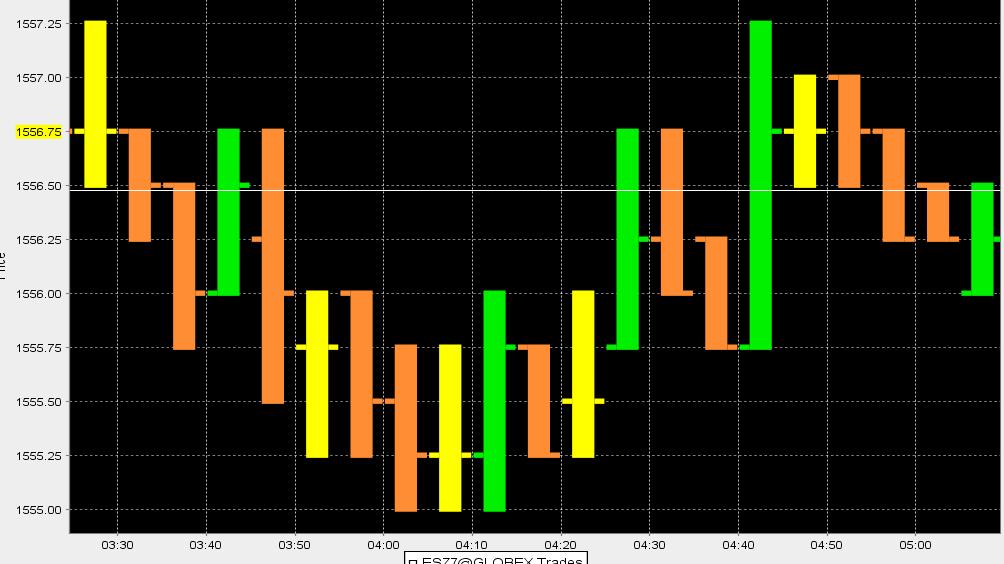
3) Look at the over night triples..they sat at 1555
4) Value area high was 1561 coming into today so with an overnight high of 1560 and an opening inside the previous days value area, this seemed like a good area to trade against
Ok here are some charts:
30 minute from Monday:
Overnight showing the triples
Hi Pips,
Can you post some charts covering your ideas? It would really help
me figure out your style and understand what you see.
Thanks
Bruce
Can you post some charts covering your ideas? It would really help
me figure out your style and understand what you see.
Thanks
Bruce
quote:
Originally posted by pips2007
Hello Bruce,
Kindly post those charts when you can. I trade emini russell...as all should know...and yes, I watch the ES chart...
But I was lkg for a short and on Er I went short at 823.10..I am waiting for 808 area... Since I expect the mkt to reach some sort of low come 25/26...808 area is a foregone conclusion in my mind and prior to 25/26..we may see 801-797...but 808..should come by...........good luck
Looking for shorts up at 63.25..to retest 58- 59 area...tight control on this one...could break away
I like the way they blew out the triples that didn't trade through up at 54.50 area from yesterday.
I like the way they blew out the triples that didn't trade through up at 54.50 area from yesterday.
got 59.75 and pulling up stop on remainders to 61.75....no need to get greedy on a friday
anyone breathing today? I'm shorting 1572.25..going real light as if I can't get to 69 even then I will
be holding overnight
be holding overnight
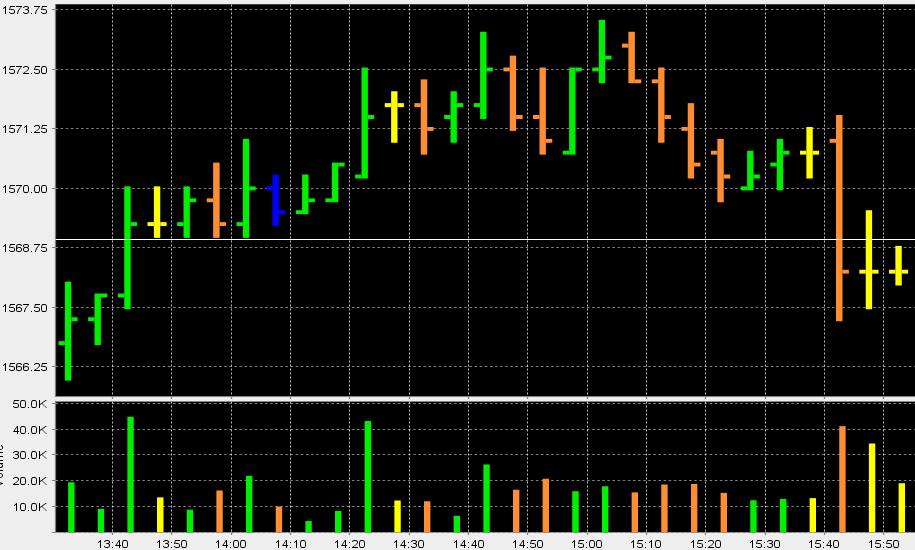
best fill for me was 67.75 on that campaign...there were 4 , 5 minute bars with matching
bottoms.....lots of stops there...chart will follow
bottoms.....lots of stops there...chart will follow
look at those 4 (5) minute bars with matching lows....so cool
at a price of 1569 beginning at around 13:45 on the chart..I can't trade against those...that was a textbook short to look for
at a price of 1569 beginning at around 13:45 on the chart..I can't trade against those...that was a textbook short to look for
Hello Bruce,
I'm not adept at downloading the charts stuff...I guess need to become a computer geek. But I don' look at charts, just prices.
Nonetheless, I keep it simple. I am trying become a better daytrader trying to understand your triples, 2.5 and 5tps trade setups and the initial pitbull strategy. Only thing missing in my daytrading is when to find overbought and oversold levels.
Many times I give up hundreds of dollars, when the mkt goes agains me but eventually my target gets hit...the pivot.
Basically, I enter a short or long on a change date. Sometimes I'm a few pts early but I just hang on and then it turns and I get the reward.
I use a service to help me decide the date. Apart from that I use nothing else no indicators,rooms,programs, services etc.If anybody wants to know the service you can email me at [email protected].
I'm not getting any commission or cut from this. The service is $25 a month and that is all I've used to go short or long at low or high prices. The service is well worth it. You won't get entry or exit prices, but you get the day when a change will happen. Most expensive purveyors are crap, but some cheap stuff if great. He is a great chap and trades options as well so he is doing the stuff...no selling only.
On another note, I use Strategy Runner for my charts and was lkg at this RSI thing. I need to find overbought or oversold levels during the day so I can reverse my entries. Any advice? Some say use e-signal..but don't know if it make a difference in my objective!
Any advice for finding overbought or oversold levels during the day with the principle of keeping it simple would be appreciated. I only use one monitor and don't want it clogged up with too many indicators. I'm lkg to maximize profit...not change my strategy.
In an earlier post, maybe another topic, I mentioned a high area would be 7/8/9. I have been shorting since the 8th...getting out at 842/843 area...On the 8th I was expecting ER to get to 837/838, but when ES hit the pivot first...I got out.
So far the count is a little over 20 pts...only shorting..did not go long, although today I had a feeling it could get up to 851 area. I got out at 843.80 area from my short..and had a funny feeling it was going up.
I did a perfunctory WW pattern..10 min chart and it pointed to 851/852 area. I set a limit at 851.90...but my mind flipped and I took it out.and then I went out.
You may say why did I not go long...well I'm only lkg for shorts ...and I not a good daytrader, up and down..just go with change date theory.
Lets see where we get to in next 2 days..I'm short at 849.90 lkg for 842/836 area....If I'm correct that last up move should have cleared any shorts on the stop outs...and set it motion the down drop. Lets see if I'm correct.
Good luck
Shorted 81.50..will add at 85 if needed..targeting only 78 area unless I add on up at 85..then plan changes..
Excellent trading pt and thanks for that great explanation Bruce!
Emini Day Trading /
Daily Notes /
Forecast /
Economic Events /
Search /
Terms and Conditions /
Disclaimer /
Books /
Online Books /
Site Map /
Contact /
Privacy Policy /
Links /
About /
Day Trading Forum /
Investment Calculators /
Pivot Point Calculator /
Market Profile Generator /
Fibonacci Calculator /
Mailing List /
Advertise Here /
Articles /
Financial Terms /
Brokers /
Software /
Holidays /
Stock Split Calendar /
Mortgage Calculator /
Donate
Copyright © 2004-2023, MyPivots. All rights reserved.
Copyright © 2004-2023, MyPivots. All rights reserved.


