26 May 2005 (Thursday)
Session Start: Thu May 26 08:32:30 2005
Session Ident: #t1
[09:16:49] <guy> help wanted at 10 am
[09:26:28] <mashhad> Guy, will u wait 10 am before taking a position?
[09:26:54] <guy> no
[09:27:06] <guy> i'll get straight in on an alpha signal + OR
[09:27:08] <guy> looking now
[09:27:18] <guy> ES has an OR trade
[09:27:24] <mashhad> yes
[09:27:47] <guy> after the first minute you should reload AlphaA1
[09:28:01] <mashhad> ok
[09:28:43] <guy> watch the k-line in particular after the first minute
[09:29:02] <guy> if it is not lower than -1 then don't short the OR
[09:29:52] <mashhad> i see.. this will be interetesting.. first OR trade using alpha
[09:32:04] <mashhad> is your alpha + ? mine is
[09:32:13] <guy> yes
[09:32:18] <guy> alpha is +
[09:32:23] <guy> k-line is moving up
[09:33:01] <guy> so no short for me yet - on either ER2 or ES
[09:33:17] <mashhad> so according to JP's rule about 6.75 would be the rigt place right?
[09:34:03] <guy> well - i think 5.75 is the entry price limit order
[09:34:09] <guy> and the stop is 7.25
[09:34:51] <guy> so need to wait for a fill at 5.75 to get short the OR trade
[09:35:36] <mashhad> well, at the moment, alpha is not advising at 5.75
[09:35:57] <guy> exactly
[09:36:06] <guy> so i'm not shorting this because
[09:36:11] <guy> this is directly against alpha
[09:36:46] <guy> Here is the ES chart
[09:36:54] <guy2>
[09:37:10] <guy> Here is the ER2 chart:
[09:37:22] <guy2>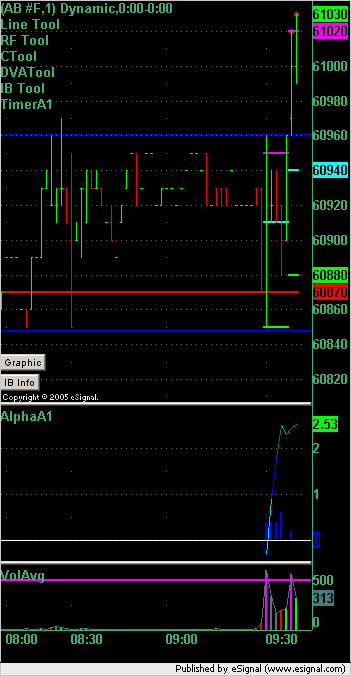
[09:38:51] <guy> so mash: even though this is a valid OR short here on both ER2 and ES I am NOT taking it
[09:39:01] <guy> because alpha has filtered me out of the trade
[09:39:15] <guy> if alpha changes before this OR trade is over and the trade is still valid
[09:39:19] <guy> then i will enter the short
[09:39:33] <mashhad> ok
[09:40:35] <guy> i'm actually watching the k-line a bit more than i am the value of alpha right now because we're at the open and k-line gives better indication after the first minute or two
[09:40:45] <guy> (and at extremes)
[09:41:20] <guy> Here is the ER2 chart:
[09:41:28] <guy2>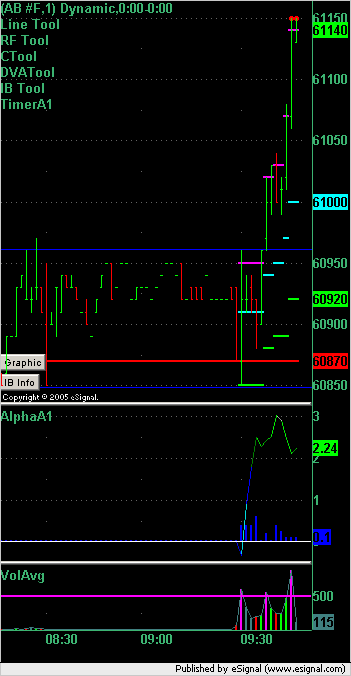
[09:41:39] <guy> the high k-line reading is saying we go up
[09:41:45] <guy> so no short OR here
[09:42:01] <guy> Same on ES:
[09:42:13] <guy2>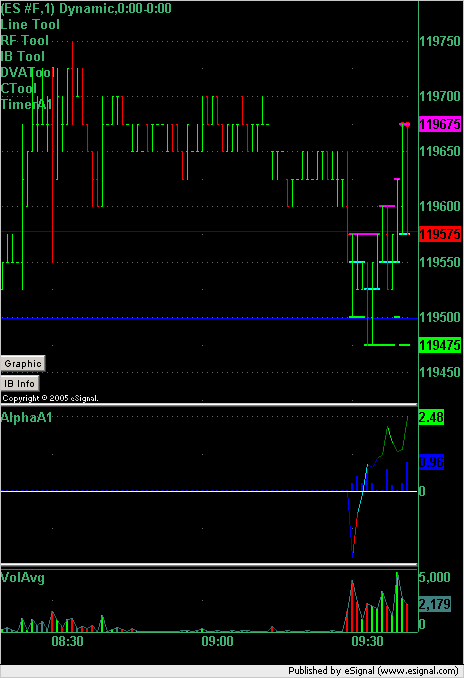
[09:45:00] <guy> ES Looks like a long to me here:
[09:45:01] <guy2>
[09:45:18] <guy> I'm thinking long off the bottom of the OR at 1195.00
[09:47:03] <mashhad> well, 6.75 was tue.'s high of the day
[09:47:18] <mashhad> so there may be some resistanse there for a long
[09:56:26] <guy> ES chart:
[09:56:47] <guy2>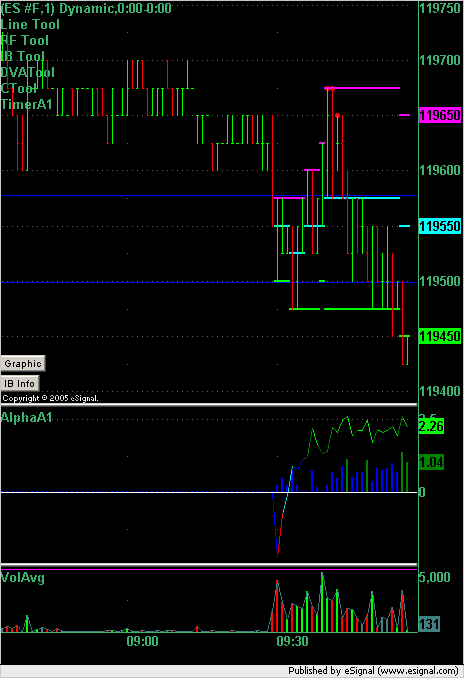
[10:05:20] <guy> Current reading on ER2
[10:05:25] <guy2>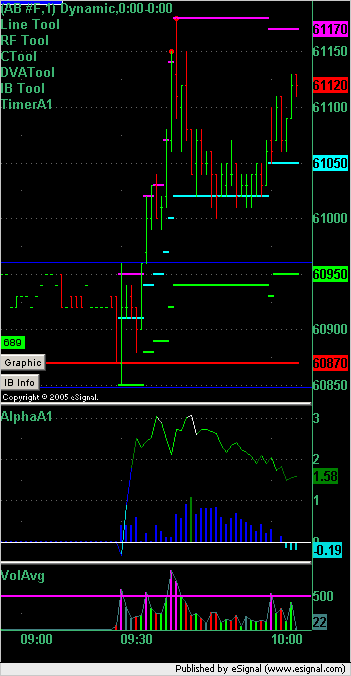
[10:13:19] <guy> And this is why I don't fade alpha on an OR trade:
[10:13:22] <guy2>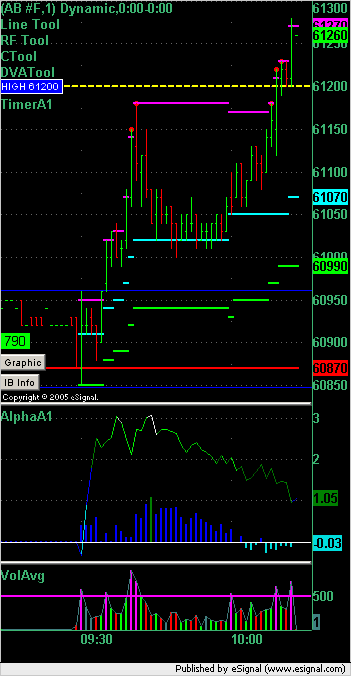
[10:13:50] <guy> you might notice a new indicator on that chart i've just posted
[10:14:06] <guy> That is what is drawing the red circles above the bars
[10:14:19] <guy> and the numbers in green above the buttons
[10:14:24] <guy> It's called TimerA1
[10:14:30] <mashhad> and what does that show?
[10:16:15] <mashhad> broke through 6.75 next res. should be 9.00 if it tries to go higher
[10:18:18] <guy> Here is the ES chart showing why I stayed out of the OR trade there:
[10:18:18] <guy2>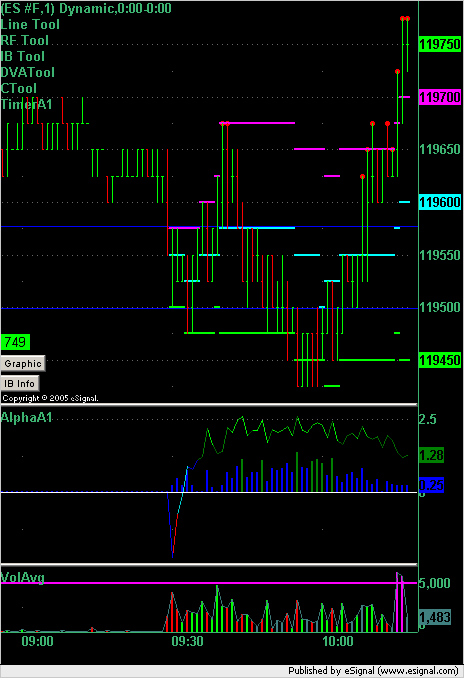
[10:18:42] <guy> hey mash: apart from making money with alpha you also need to think about the losing trades that it kept you out of
[10:18:50] <guy> as both a filter and a signaller
[10:21:08] <mashhad> yes... i do like that about alpha..
[10:23:21] <guy> i'm not sure how you would have played that OR trade but what I would do now if I were you would be to replay that trade and think about the OR rules that you use and see what you would have made/lost with and without the alpha there...
[10:23:59] <guy> you might have actually made money on the OR trade if you'd had small targets and tight stops
[10:24:13] <guy> but I think that the ultimate target on the OR trade is the VAH
[10:25:38] <mashhad> it was kind of close.. i like to take the trade +1.00 from top of open which would have been 6.75, and it would have paid me +2.00 if i had that fill, if no fill, i would have been out of this trade
[10:27:16] <guy> right - what trading platform are you using?
[10:27:42] <guy> i ask because if you're using ninja i think that it will give you a fairly accurate simulation of whether or not you got filled
[10:28:04] <guy> so if you enter your order at 6.75 and there were 1000 contracts there when you entered your order
[10:28:13] <guy> and subsequently 1000 trade at that price
[10:28:24] <guy> then it will give you a fill
[10:28:28] <guy> to keep it realistic
[10:28:46] <mashhad> i use my broker's platform
[10:28:56] <mashhad> it's not real fancy
[10:29:08] <mashhad> very simple
[10:29:53] <guy> k
[10:30:31] <guy> i only mention that because it makes testing more realistic
[10:30:32] <guy2>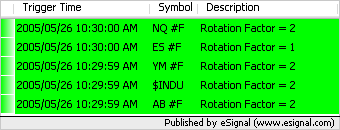
[10:32:55] <mashhad> 99.00 is the weekly high
[10:34:28] <guy> and the pressure from alpha is easing
[10:38:20] <guy2>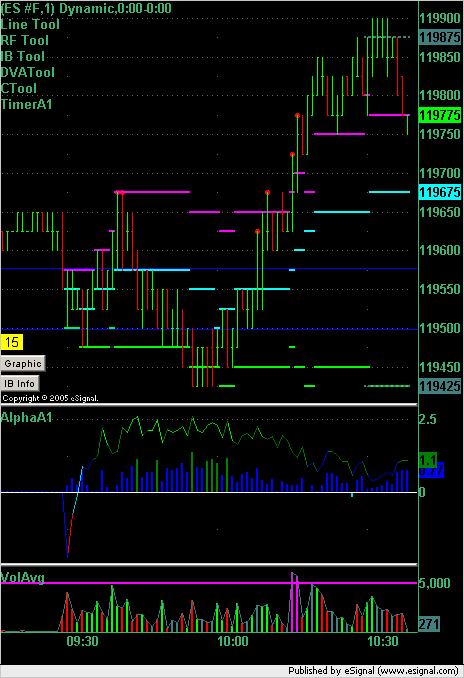
[10:48:02] <fspeculator> EOM window dressing?
[10:48:29] <fspeculator> but there are still 3 days
[10:48:54] <fspeculator> i think the most deciding factor is relentless pumping (creation of money) by US Fed
[10:49:18] <mashhad> when is the next fed meeting?
[10:49:29] <fspeculator> 35days
[10:58:14] <guy2>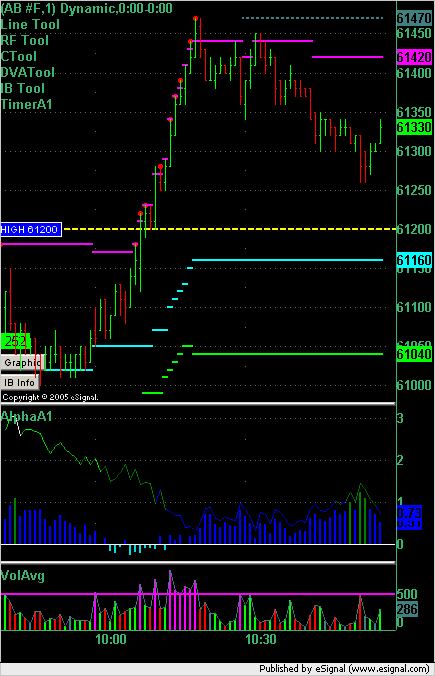
[10:58:39] <guy> 3 x +1 bars on alpha on ER2 there
[10:59:47] <tuna> divergence guy?
[11:00:33] <guy2>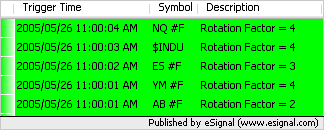
[11:00:56] <guy> it looks like divergence but alpha is not designed to be used as a divergence tool because it is not an oscillator
[11:01:52] <mashhad> alpha gave a buy at 6.75 which happened to be that area of resistance we had earlier and DPOC
[11:02:40] <mashhad> i think it's gonna be a good signal...I should have taken it!
[11:02:51] <guy> yes it did and also alpha is +ve so we're looking for buy areas
[11:05:16] <guy> Buys AB @ 612
[11:06:09] <tuna> me too
[11:07:23] <guy> can someone tell me what oil is doing - i've lost my oil chart
[11:07:34] <tuna> 51.35
[11:07:49] <tuna> 51.27
[11:08:21] <guy> thanks
[11:08:36] <fspeculator> +0.64%
[11:08:42] <fspeculator> on top of yesterday's +3.3%
[11:08:55] <guy> thanks fspec
[11:09:00] <guy> here is my trade
[11:09:01] <guy2>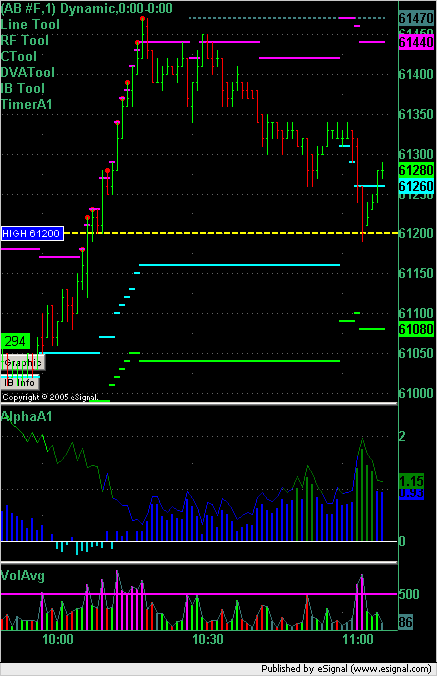
[11:09:07] <guy> it was 90% alpha instigated
[11:09:25] <guy> and 10% was off the high (all sessions) from yest.
[11:10:08] <guy> exit stop set AB @ 611
[11:10:29] <guy> still very much in the embryo stage so we haven't made anything on it yet and could still lose 1 point
[11:10:52] <guy> good news is that alpha continues to support the trade:
[11:10:53] <tuna> it was single instigated here
[11:10:55] <guy2>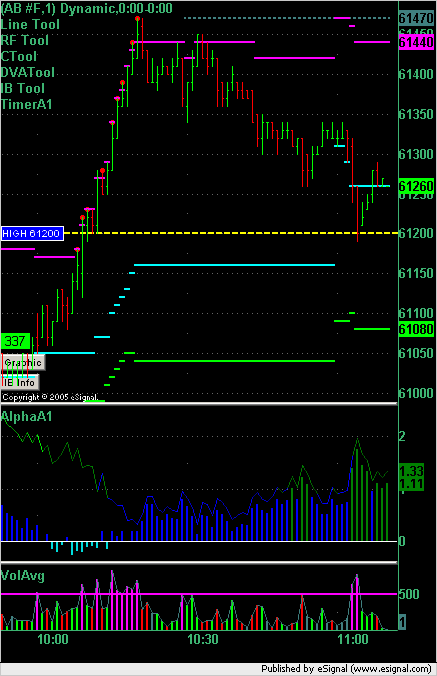
[11:11:07] <tuna> oh goody
[11:12:08] <tuna> plus vwap
[11:12:38] <tuna> vwap was real close to there too i should add
[11:13:56] <guy> vwap is volume weighted average price right?
[11:14:39] <fspeculator> y
[11:14:49] <fspeculator> volume poc so to say
[11:15:11] <tuna> well said fspec
[11:15:32] <guy> okay
[11:15:44] <guy> how do you identify it tuna? using the MP chart?
[11:15:51] <guy> that long is also a single print long btw
[11:15:56] <tuna> wish esig had it
[11:16:09] <tuna> right
[11:16:30] <tuna> that was my entry
[11:16:41] <tuna> that and vwap
[11:17:06] <fspeculator> vwap 96.75?
[11:17:20] <tuna> 612's
[11:17:25] <guy> so what do you use? chart/software to identify VWAP?
[11:17:39] <tuna> qt
[11:17:59] <guy> k
[11:18:00] <fspeculator> i'm a bit weary about these things
[11:18:08] <fspeculator> in 7pt ES ranges (let alone4pt)
[11:18:17] <tuna> fabulos charts amost free
[11:18:18] <fspeculator> every tick has a "meaning"
[11:18:34] <guy> the single print strategy has another winner today
[11:18:39] <fspeculator> tuna you use it with IB and backfill?
[11:18:47] <tuna> no
[11:18:57] <tuna> iqfeed
[11:19:15] <tuna> 1 off at 13
[11:20:06] <guy> [11:09:07] <guy> it was 90% alpha instigated
[11:20:06] <guy> [11:09:25] <guy> and 10% was off the high (all sessions) from yest.
[11:20:28] <guy> Had I noticed at the time that there was a single there I would have had even MORE conviction on that trade
[11:20:45] <tuna> lol
[11:20:53] <tuna> jeez guy
[11:21:02] <guy> I'm going to have to modify the DVATool to put in confirmed and unconfirmed singles for me
[11:21:16] <guy> so I don't miss stuff like that
[11:21:40] <tuna> those little things
[11:22:01] <fspeculator> guy you mean unconf singles for today's trade?
[11:22:28] <guy> correct fspec: so once a single is created but not confirmed a line is drawn in
[11:22:35] <guy> and if we trade through it then it's removed
[11:22:51] <guy> and the unconfirmed line will be a different style/color
[11:22:58] <guy> so we know that it's not a confirmed single
[11:23:28] <guy> and then once confirmed changed to the standard singles color
[11:28:12] <tuna> sounds like a plan
[11:30:15] <tuna> another one off here
[11:30:27] <guy> nice tuna
[11:30:32] <guy2>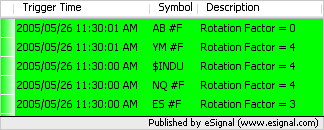
[11:30:36] <tuna> tanks guy
[11:36:12] <tuna> chicago
[11:36:55] <guy> k
[11:41:31] <guy> okay my thinking here and now:
[11:41:40] <guy2>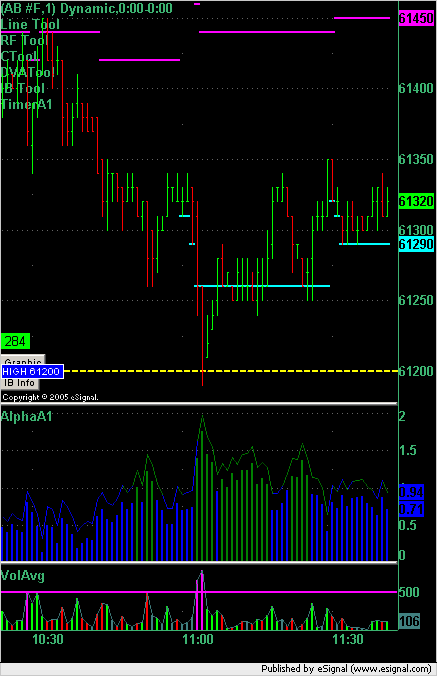
[11:41:46] <guy> i am thinking that we can get RE to the upside
[11:42:00] <guy> so i'm looking to hold this long until at least RE and beyond
[11:42:14] <tuna> k
[11:42:25] <guy> if we hit RE extension I will look at 2 things:
[11:42:46] <guy> 1. If RE is a spike over the IB and no new business
[11:42:48] <guy> and
[11:42:56] <guy> 2. alpha not showing buying signs
[11:43:01] <guy> then i'll probably get out
[11:43:33] <guy> if, however, there is good follow through in both buying at and beyond RE indicating new business there and alpha shows follow through
[11:43:51] <guy> then I'll try and sit on it for the rest of the day hoping for it to turn into a trend day up
[11:44:05] <guy> but as i've been typing that the market is going against this trade
[11:44:25] <tuna> hmmm we have oops had a ledge
[11:44:28] <guy2>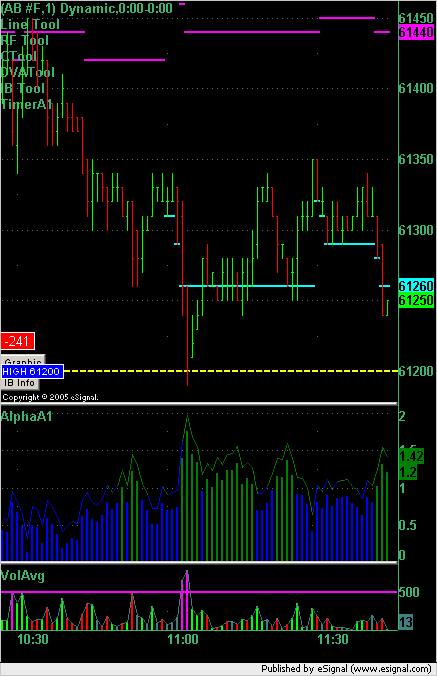
[11:46:06] <tuna> another trip back to the vwap
[11:47:31] <tuna> prolly wont hold
[11:47:35] <tuna> imo
[11:47:54] <tuna> but i hope im wrong
[11:49:47] <guy> hard to tell but alpha seems green and happy so i will play out the odds
[11:50:31] <tuna> yeah im still in too with last 1
[11:52:16] <tuna> 89 ema at 11 on a 3min chart fwiw
[11:53:21] <guy> i've got my oil chart back and i can see the problem
[11:53:42] <guy> oil is going up and that's what is puting the dampener on the equities
[11:55:50] <tuna> was some sort of news about the bigs saying they're not gonna drill/develope new fields or something like that
[11:56:42] <guy> which should push the price down not up...
[11:57:05] <tuna> yeah,,one would think so
[11:58:59] <fspeculator> guy have you run some correlation analysis of oil-vs-stocks?
[11:59:18] <guy> yes
[11:59:31] <fspeculator> what was the result? and what timeframe please
[11:59:49] <fspeculator> and how? was it up-up, up-down etc?
[12:00:09] <fspeculator> or you take the magnitude of the move into account?
[12:00:23] <fspeculator> bec all i see is that oil is advancing up along equities
[12:00:30] <guy2>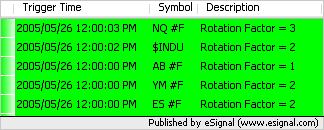
[12:00:32] <fspeculator> and also bonds are advancing along equities
[12:01:04] <mashhad> Guy, would you say that ES is showing a little weakness on the long side since alpha went - for a few mins?
[12:01:26] <guy> Oil and E-mini S&P500
[12:01:30] <guy> that link fspec
[12:02:20] <guy> mash: here is the ES chart:
[12:02:26] <guy2>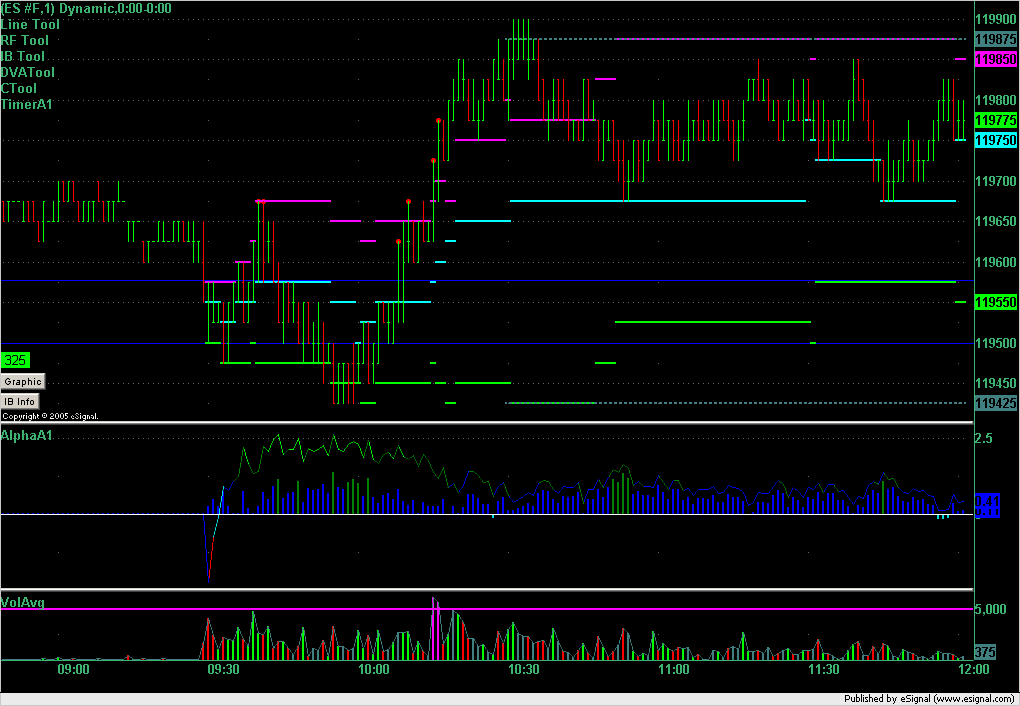
[12:02:28] <guy> and yes, I agree with your comment
[12:02:54] <guy> especially when compared to ER2 chart:
[12:03:01] <mashhad> ok
[12:03:03] <guy> where alpha is showing far more strength on the ER2
[12:03:04] <guy2>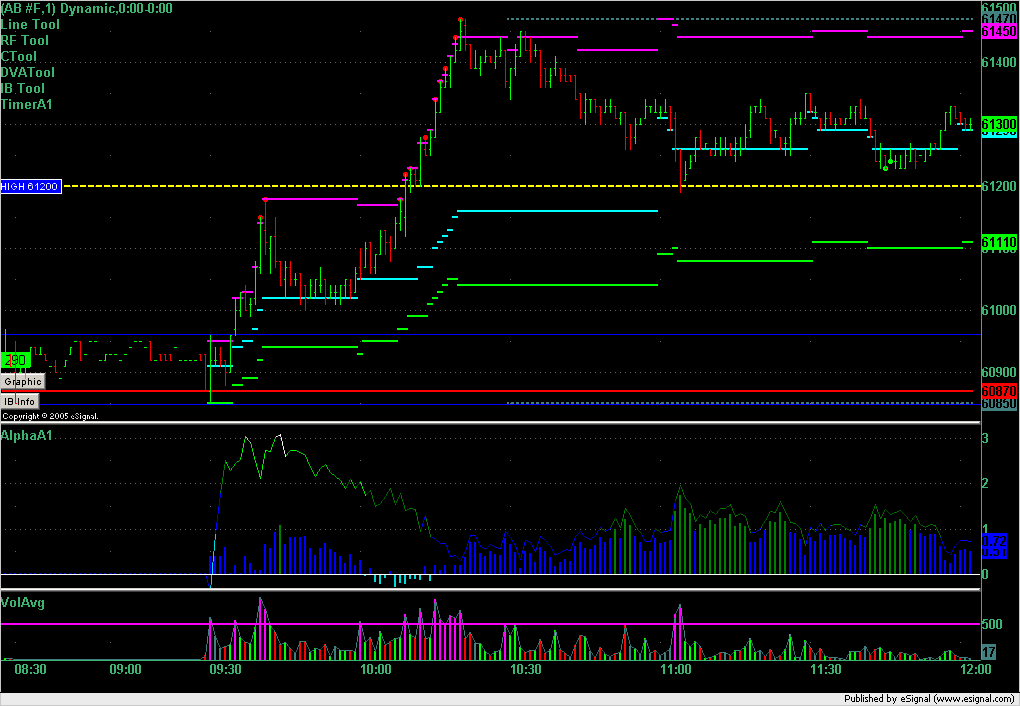
[12:09:15] <fspeculator> guy your alpha is mkt specific?
[12:09:21] <fspeculator> ie different for ES than ER?
[12:12:19] <guy> no - same formula
[12:13:51] <tuna> time to water the flowers bbiab
[12:14:16] <guy> k
[12:16:18] <fspeculator> guy i've read your piece on oil
[12:16:42] <fspeculator> i think if you do an analysis over a long period of 6-12mo or more
[12:17:03] <fspeculator> that last few years oil has had very little NEGATIVE impact on stocks
[12:17:22] <fspeculator> you may even find that it "boosted" stocks (positive correl)
[12:17:37] <fspeculator> as both oil and stocks had huge run-ups since 2003
[12:17:47] <fspeculator> my opinion is that the reason is inflation
[12:18:10] <guy> fspec - i think that i noticed most of the -ve correlation at oil extremes
[12:18:23] <fspeculator> increasing price in stocks, real-estate, oil, gold etc
[12:19:21] <fspeculator> as paper money becomes more abundant, EVERYTHING goes higher in price
[12:19:40] <fspeculator> everything of some scarcity
[12:29:30] <tuna> hmmm
[12:30:12] <tuna> shoulda changed the oil too
[12:30:39] <guy> :)
[12:30:53] <guy> here come the split counts
[12:31:00] <guy2>
[12:31:35] <guy> the one that i'm long is showing the worst split count
[12:31:50] <tuna> i noticed
[12:32:17] <tuna> sox are very strong
[12:32:34] <tuna> above my weekly r1
[12:53:28] <guy> exit stop moved to breakeven AB @ 612
[13:00:36] <guy2>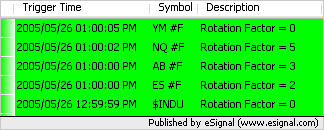
[13:02:09] <fspeculator> guy you really caught the bottom tick this time? :-)
[13:02:31] <guy> i did - so did the 'single print' strategy
[13:03:06] <guy> but could still breakeven if I get stopped
[13:04:03] <tuna> does it count if you didnt see the single?
[13:04:38] <guy> yes - the forward testing single counts because you can do the figures after the day is over
[13:04:42] <guy> it's a mechanical system
[13:04:53] <guy> and i'm testing it and not trading it
[13:05:04] <tuna> oh
[13:05:05] <guy> it is just coincidence that i'm long
[13:05:10] <guy> at the same point
[13:05:25] <tuna> yes
[13:05:26] <guy> i hadn't noticed that the forward testing system was also long
[13:06:16] <guy> i'm trying to work on the algorithm now to get the unconfirmed singles to print on the chart - boy it's complicated
[13:07:16] <tuna> see if you can come up with a vwap that plots like a ma
[13:07:45] <guy> i think i've tried that before but i don't think that esignal gives me the volume info that i need
[13:07:57] <tuna> ahh
[13:08:00] <tuna> ok
[13:08:08] <mashhad> Guy, how about VAh/l and POC?
[13:08:23] <guy> DVATool plots those mash
[13:08:26] <guy> it's an option
[13:08:44] <mashhad> oh,ok.. because i didn't see them on your charts
[13:09:48] <guy> Have a look at this chart mash:
[13:09:53] <guy2>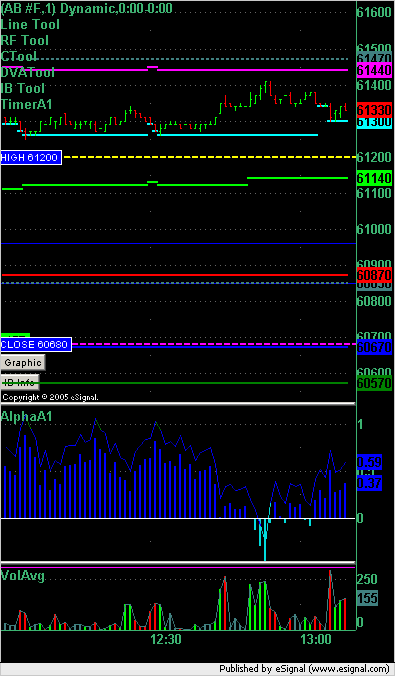
[13:10:14] <guy> from the bottom, the solid lines, green, blue, red
[13:10:21] <guy> are VAL, POC, VAH
[13:10:33] <guy> and those are put there by DVATool
[13:10:48] <guy> and then higher up the lime, cyan and pink lines are the
[13:10:57] <guy> DVAL, DPOC, and DVAH
[13:11:06] <guy> also put there by DVATool
[13:12:06] <guy> all the colors and styles can be changed
[13:12:13] <mashhad> so 608.30 which is the VAH, is that the gray line?
[13:14:08] <guy> no, the solid red line at 608.7 is the VAH
[13:14:21] <guy> different to esignal's which is 608.3
[13:15:02] <mashhad> you mean it calculates on it's own?
[13:15:05] <guy> i'm still working on the formula and not 100% convinced that esignal is correct here
[13:15:23] <guy> but i'm planning on adding an option to replicate esignal if that's what we want to do
[13:15:31] <guy> yes it calculates it mash
[13:15:42] <guy> from the previous day's data
[13:15:50] <mashhad> i see..
[13:16:05] <guy> the grey dotted line is the IBL
[13:17:23] <guy> another useful feature of the DVATool is the Graphic button
[13:17:38] <guy> On this ES chart:
[13:17:49] <guy2>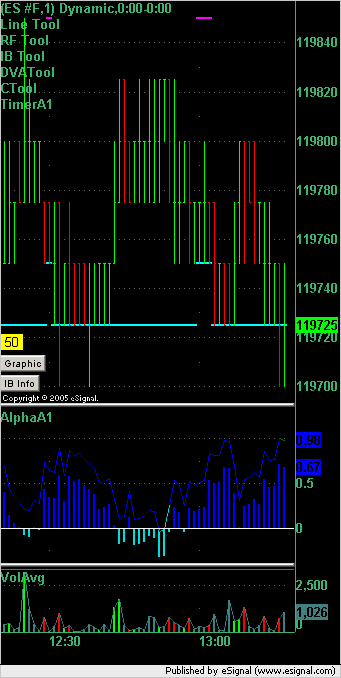
[13:17:49] <guy> see the Graphic button in the bottom left hand corner?
[13:18:11] <guy> Well if you click it you get this graphic:
[13:18:16] <guy2>
[13:18:35] <guy> which allows you to quickly view an MP graphic off any line chart without having to bring up a seperate MP chart
[13:19:23] <mashhad> but these VA's are different from E-signal
[13:20:17] <mashhad> right now es-gnals's val is 6.75 and your is 5.75
[13:21:19] <guy> i've got 6.25 on esig
[13:21:46] <guy> and 5.75 on mine
[13:21:51] <mashhad> now, but when u posted it was 6.75.. in anycase, 6.25 is 0.5 diff too
[13:22:30] <guy> true
[13:22:52] <guy> i'm looking into the difference
[13:22:59] <guy> i'll see if i can resolve it
[13:23:16] <mashhad> well, u never know though, yours might be more accurte
[13:24:21] <mashhad> got to observe it for a while .. it's difficult on Dvas but on VA's it could always be looked at for the opening trades to see which one gives a better signal, yours or e-signals
[13:24:24] <guy> well mine is according to the Dalton book
[13:24:36] <guy> and the esignal one according to the steidlmeyer book
[13:24:45] <guy> and it is an "area"
[13:24:54] <guy> which I use alpha with
[13:25:01] <guy> so it doesn't affect my profits
[13:25:12] <guy> but I can see how other people would prefer it to be to the tick
[13:28:36] <guy> Here is a chart showing the new TimingA1 tool
[13:28:48] <guy2>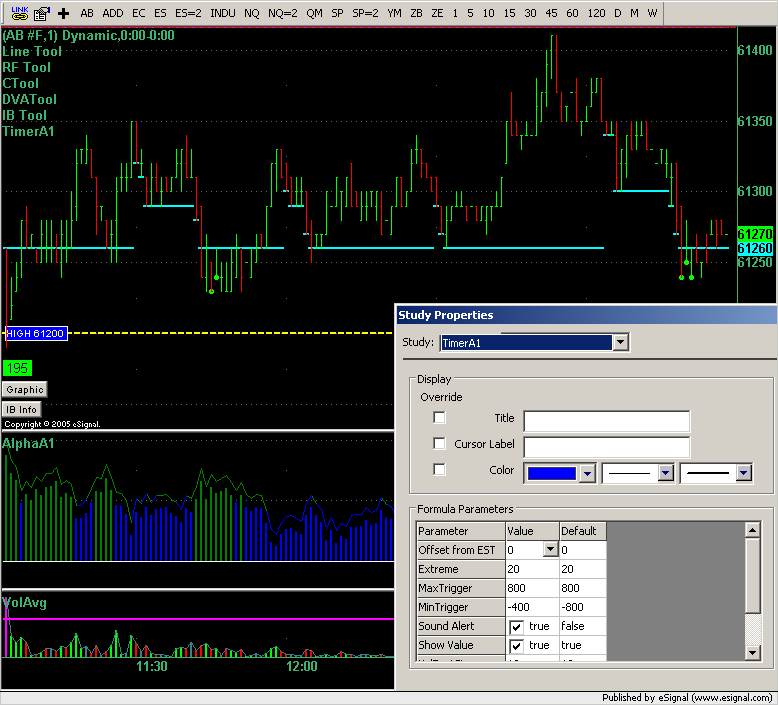
[13:28:59] <guy> Sorry TimerA1
[13:29:29] <guy> you can see the parameters that I've set: 20, 800, -400
[13:29:54] <guy> and it put 2 green buy blobs around 11:40
[13:30:10] <guy> and has just now put 3 green buy blobs at this recent low
[13:30:24] <guy> current RF:
[13:30:32] <guy2>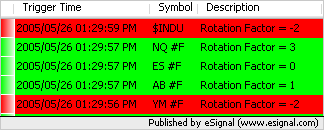
[13:31:41] <guy> bbiab - hard stop in place
[13:38:45] <tuna> that was just anoyher trip to the vwap on er2
[13:38:53] <tuna> another
[13:51:39] <guy> Exited all Long AB at 613 --> + 1
[13:52:04] <guy2>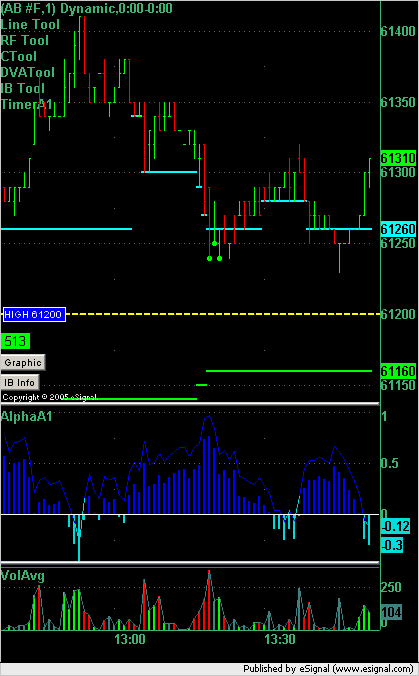
[13:52:09] <tuna> vn
[13:52:12] <guy> support from alpha is no longer with us
[13:52:21] <guy> so i've decided to abandon this trade here
[13:53:40] <guy> thx tuna
[13:55:24] <tuna> i still have the 1 long
[13:55:54] <tuna> almost added near dval
[13:56:06] <mashhad> i am looking at a place to short on ES
[13:59:30] <guy> here is the ES chart:
[13:59:36] <guy> why do you want to short mash?
[13:59:37] <guy2>
[13:59:43] <guy> we've just had an alpha buy
[14:00:06] <guy> are you looking to short the DVAH?
[14:00:17] <mashhad> yes
[14:00:23] <guy> RF's for ES are 0:
[14:00:29] <guy2>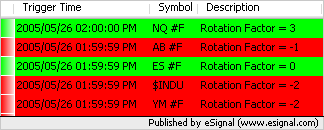
[14:00:54] <guy> I have DVAH at 98.75 = what does esig MP have?
[14:01:04] <mashhad> same
[14:01:36] <mashhad> i am working 8.50 at the moment
[14:02:28] <guy> good strategy, 99.00 is HOD and that's 2 ticks below that and 1 tick below IBH
[14:02:46] <mashhad> and if i get filled, i am only risking 4 ticks
[14:02:58] <guy> the only thing that I would watch in your position is the value of alpha when you get filled
[14:03:11] <mashhad> exactly
[14:03:29] <tuna> keep in mind spoos has re up
[14:03:33] <tuna> fwiw
[14:03:45] <guy> how many ticks RE in SP?
[14:03:51] <tuna> 4
[14:04:13] <mashhad> was that in the f bracket?
[14:04:20] <tuna> just thought id pass it along
[14:04:28] <tuna> yes sir
[14:04:33] <mashhad> ok
[14:05:06] <fspeculator> just 4 ticks in RE?
[14:05:08] <fspeculator> in SP?
[14:05:20] <mashhad> now e-signal dvah dropped to 8.25..yours?
[14:05:45] <guy> no still at 8.75
[14:06:12] <tuna> 8.25 here
[14:06:15] <tuna> too
[14:07:06] <guy> you got MP on QT tuna?
[14:07:16] <tuna> spoos doesnt have that bottom ledge like es does
[14:08:23] <tuna> but it has a top one
[14:09:53] <tuna> no guy qt doesnt have mp
[14:11:37] <tuna> spoos chart isnt nearly as ugly as es imho
[14:12:40] <guy> how do you see the MP chart tuna?
[14:13:56] <tuna> it just doesnt have that bottom ledge on the 'p' like the es does,,also re up unlike es
[14:17:40] <mashhad> it doesn't look like alpha is gonna give a strong sell signal at 8.50
[14:18:12] <mashhad> moved order to 8.75
[14:18:45] <guy> here's your chart mash:
[14:18:50] <guy> you should see the same on yours
[14:18:56] <guy2>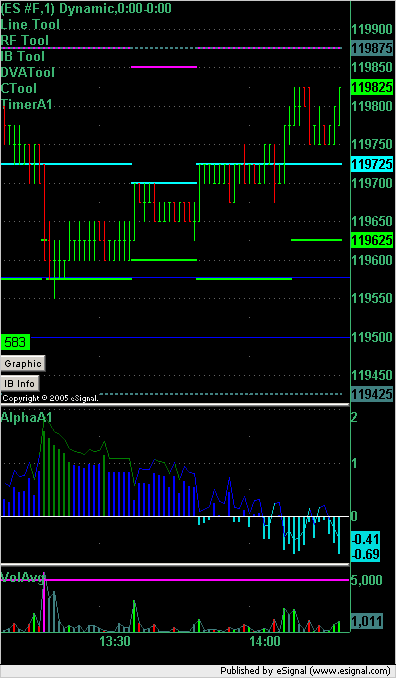
[14:19:07] <guy> so i have both IBH and DVAH
[14:19:12] <guy> at same 98.75
[14:19:21] <guy> and alpha at around -.5
[14:25:34] <tuna> guy,new paltalk will try to auto start on your start up fwiw
[14:26:22] <tuna> tries to load a trojan too
[14:26:52] <tuna> pm's sit in the tray now
[14:27:34] <guy> thanks tuna
[14:28:01] <guy> what cleans out the trojan? adaware? pest patrol?
[14:28:12] <mashhad> s 98.75
[14:28:20] <guy> good trade mash
[14:28:27] <mashhad> hard stop 00.25
[14:28:34] <tuna> nod32
[14:28:43] <guy2>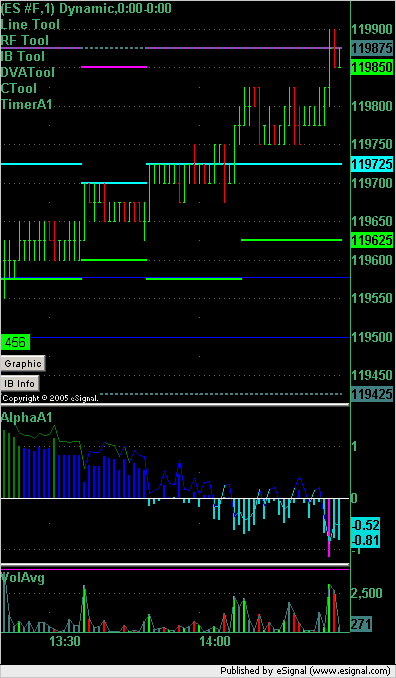
[14:28:47] <tuna> i use nod32 beta
[14:28:50] <guy> there's your chart mash
[14:28:56] <guy> good luck
[14:29:10] <mashhad> thanks
[14:29:15] <guy> you've got alpha + DVAH + IBH + HOD all on your side
[14:29:25] <guy> i have to step away now but will be back...
[14:29:36] <tuna> spoos single ticked
[14:29:44] <tuna> fwiw
[14:31:18] <mashhad> what do u show for ur dval?
[14:31:43] <tuna> er2 is trying my patience again
[14:32:03] <tuna> me?
[14:32:29] <mashhad> no guy
[14:37:32] <guy> my DVAL is 1196.25 now
[14:37:47] <guy> here is a chart
[14:37:51] <guy> DVAL is the lime line
[14:37:53] <tuna> oil closed red btw
[14:37:57] <guy2>
[14:38:09] <guy> you can see that it dipped to 96.00 but it's back at 96.25 now
[14:38:38] <mashhad> so urs is 6.25 vs. esig 6.75
[14:38:49] <guy> yes
[14:39:01] <guy> very nice trade btw
[14:39:06] <guy> thanks for the oil update tuan
[14:39:07] <mashhad> btw, your dvah was more accurate since we hit 99
[14:39:08] <guy> tuna
[14:39:16] <guy> bbiab
[14:39:17] <mashhad> +2 on 1st contract! :)
[14:39:27] <guy> excellent !! :)
[14:39:49] <mashhad> setting my stop at 99.25 against any range extension
[14:42:49] <tuna> nice mash
[14:43:56] <mashhad> thanks
[15:00:36] <guy2>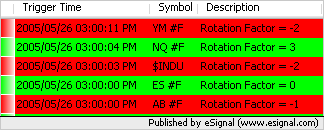
[15:31:43] <guy2>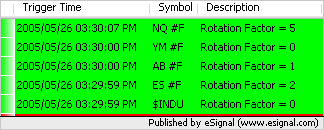
[15:35:25] <mashhad> out -0.50
[15:35:58] <guy> you made money though
[15:36:05] <guy> good hold there
[15:36:06] <tuna> lol guy
[15:36:08] <mashhad> yes,
[15:36:22] <mashhad> made 1.5+
[15:36:43] <mashhad> i actually got to run, see you tomorrow
[15:36:45] <tuna> nice mash
[15:37:16] <tuna> guy i still have the last 1
[15:37:33] <guy> excellent tuna!
[15:37:49] <tuna> what a test
[15:37:59] <guy> very good hold there
[15:38:13] <tuna> was NOT easy
[15:41:47] <tuna> but it was a free trade,, so not too bad
[15:42:26] <guy> true
[15:50:15] <tuna> seems like singles that match up with the vwap work pretty well
[16:00:50] <guy2>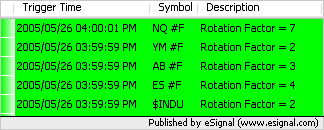
[16:01:35] <guy> This is interesting:
[16:01:40] <guy2>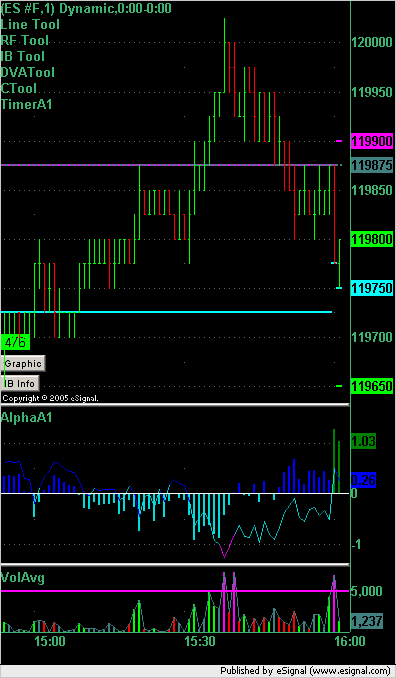
[16:01:46] <guy> alpha on ES is showing a buy signal
[16:01:54] <guy> and on ER2 a sell signal
[16:02:04] <guy> don't know if i've ever seen that together before
[16:02:12] <tuna> thx guy
[16:02:30] <guy2>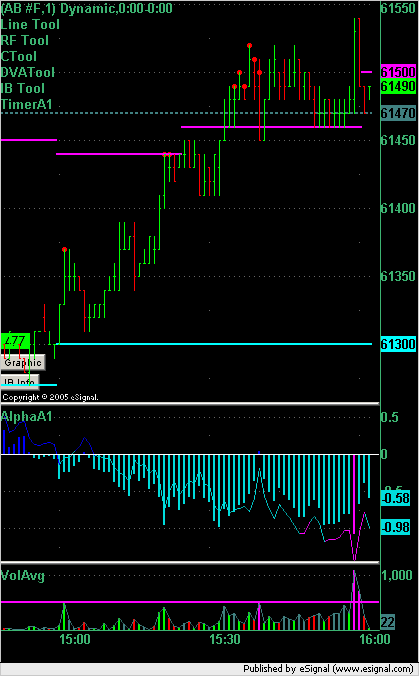
[16:02:33] <guy> y/w tuna
[16:02:49] <guy> still long tuna?
[16:03:18] <tuna> no
[16:03:47] <guy> good trading - you must have taken about 3 points on that last contract
[16:04:53] <tuna> yep last 1 was woth the wait
[16:04:59] <tuna> worth
[16:05:02] <guy> excellent :)
[16:05:13] <guy> i like it when people make points :)
[16:05:39] <tuna> was that or go change the oil
[16:05:55] <guy> finished watering the garden then?
[16:06:02] <tuna> yes
[16:06:21] <guy> changing the oil on your car?
[16:06:28] <tuna> right
[16:07:01] <guy> messy job - but has to be done
[16:07:13] <tuna> i have all weekend to do that tho
[16:07:56] <guy> not going away for w/e then?
[16:08:10] <tuna> nahh
[16:08:45] <tuna> cant afford the gas ;)
[16:08:53] <guy> :)
[16:09:07] <guy> It looks like the single print strategy is going to close its last contract at the last traded price
[16:09:24] <guy> I've just had to add another rule to the strategy that says that it doesn't carry overnight
[16:09:36] <guy> and that any open contracts close at the last traded price
[16:10:15] <tuna> im too chicken to hold overnite
[16:10:38] <guy> best not to unless you've got a good buffer and good reason
[16:11:28] <tuna> mebbe shorts are ok,,but still, anything can happen
[16:15:59] <guy> I'll update the singles shortly:
[16:16:19] <tuna> thx again guy
[16:17:35] <guy> y/w tuna
[16:24:52] <guy> Single print strategy made $870 today and cumulative for month is $2,150
[16:25:27] <guy> gn all
[16:26:25] * Disconnected
Session Close: Thu May 26 16:26:28 2005
Session Ident: #t1
[09:16:49] <guy> help wanted at 10 am
[09:26:28] <mashhad> Guy, will u wait 10 am before taking a position?
[09:26:54] <guy> no
[09:27:06] <guy> i'll get straight in on an alpha signal + OR
[09:27:08] <guy> looking now
[09:27:18] <guy> ES has an OR trade
[09:27:24] <mashhad> yes
[09:27:47] <guy> after the first minute you should reload AlphaA1
[09:28:01] <mashhad> ok
[09:28:43] <guy> watch the k-line in particular after the first minute
[09:29:02] <guy> if it is not lower than -1 then don't short the OR
[09:29:52] <mashhad> i see.. this will be interetesting.. first OR trade using alpha
[09:32:04] <mashhad> is your alpha + ? mine is
[09:32:13] <guy> yes
[09:32:18] <guy> alpha is +
[09:32:23] <guy> k-line is moving up
[09:33:01] <guy> so no short for me yet - on either ER2 or ES
[09:33:17] <mashhad> so according to JP's rule about 6.75 would be the rigt place right?
[09:34:03] <guy> well - i think 5.75 is the entry price limit order
[09:34:09] <guy> and the stop is 7.25
[09:34:51] <guy> so need to wait for a fill at 5.75 to get short the OR trade
[09:35:36] <mashhad> well, at the moment, alpha is not advising at 5.75
[09:35:57] <guy> exactly
[09:36:06] <guy> so i'm not shorting this because
[09:36:11] <guy> this is directly against alpha
[09:36:46] <guy> Here is the ES chart
[09:36:54] <guy2>

[09:37:10] <guy> Here is the ER2 chart:
[09:37:22] <guy2>

[09:38:51] <guy> so mash: even though this is a valid OR short here on both ER2 and ES I am NOT taking it
[09:39:01] <guy> because alpha has filtered me out of the trade
[09:39:15] <guy> if alpha changes before this OR trade is over and the trade is still valid
[09:39:19] <guy> then i will enter the short
[09:39:33] <mashhad> ok
[09:40:35] <guy> i'm actually watching the k-line a bit more than i am the value of alpha right now because we're at the open and k-line gives better indication after the first minute or two
[09:40:45] <guy> (and at extremes)
[09:41:20] <guy> Here is the ER2 chart:
[09:41:28] <guy2>

[09:41:39] <guy> the high k-line reading is saying we go up
[09:41:45] <guy> so no short OR here
[09:42:01] <guy> Same on ES:
[09:42:13] <guy2>

[09:45:00] <guy> ES Looks like a long to me here:
[09:45:01] <guy2>

[09:45:18] <guy> I'm thinking long off the bottom of the OR at 1195.00
[09:47:03] <mashhad> well, 6.75 was tue.'s high of the day
[09:47:18] <mashhad> so there may be some resistanse there for a long
[09:56:26] <guy> ES chart:
[09:56:47] <guy2>

[10:05:20] <guy> Current reading on ER2
[10:05:25] <guy2>

[10:13:19] <guy> And this is why I don't fade alpha on an OR trade:
[10:13:22] <guy2>

[10:13:50] <guy> you might notice a new indicator on that chart i've just posted
[10:14:06] <guy> That is what is drawing the red circles above the bars
[10:14:19] <guy> and the numbers in green above the buttons
[10:14:24] <guy> It's called TimerA1
[10:14:30] <mashhad> and what does that show?
[10:16:15] <mashhad> broke through 6.75 next res. should be 9.00 if it tries to go higher
[10:18:18] <guy> Here is the ES chart showing why I stayed out of the OR trade there:
[10:18:18] <guy2>

[10:18:42] <guy> hey mash: apart from making money with alpha you also need to think about the losing trades that it kept you out of
[10:18:50] <guy> as both a filter and a signaller
[10:21:08] <mashhad> yes... i do like that about alpha..
[10:23:21] <guy> i'm not sure how you would have played that OR trade but what I would do now if I were you would be to replay that trade and think about the OR rules that you use and see what you would have made/lost with and without the alpha there...
[10:23:59] <guy> you might have actually made money on the OR trade if you'd had small targets and tight stops
[10:24:13] <guy> but I think that the ultimate target on the OR trade is the VAH
[10:25:38] <mashhad> it was kind of close.. i like to take the trade +1.00 from top of open which would have been 6.75, and it would have paid me +2.00 if i had that fill, if no fill, i would have been out of this trade
[10:27:16] <guy> right - what trading platform are you using?
[10:27:42] <guy> i ask because if you're using ninja i think that it will give you a fairly accurate simulation of whether or not you got filled
[10:28:04] <guy> so if you enter your order at 6.75 and there were 1000 contracts there when you entered your order
[10:28:13] <guy> and subsequently 1000 trade at that price
[10:28:24] <guy> then it will give you a fill
[10:28:28] <guy> to keep it realistic
[10:28:46] <mashhad> i use my broker's platform
[10:28:56] <mashhad> it's not real fancy
[10:29:08] <mashhad> very simple
[10:29:53] <guy> k
[10:30:31] <guy> i only mention that because it makes testing more realistic
[10:30:32] <guy2>

[10:32:55] <mashhad> 99.00 is the weekly high
[10:34:28] <guy> and the pressure from alpha is easing
[10:38:20] <guy2>

[10:48:02] <fspeculator> EOM window dressing?
[10:48:29] <fspeculator> but there are still 3 days
[10:48:54] <fspeculator> i think the most deciding factor is relentless pumping (creation of money) by US Fed
[10:49:18] <mashhad> when is the next fed meeting?
[10:49:29] <fspeculator> 35days
[10:58:14] <guy2>

[10:58:39] <guy> 3 x +1 bars on alpha on ER2 there
[10:59:47] <tuna> divergence guy?
[11:00:33] <guy2>

[11:00:56] <guy> it looks like divergence but alpha is not designed to be used as a divergence tool because it is not an oscillator
[11:01:52] <mashhad> alpha gave a buy at 6.75 which happened to be that area of resistance we had earlier and DPOC
[11:02:40] <mashhad> i think it's gonna be a good signal...I should have taken it!
[11:02:51] <guy> yes it did and also alpha is +ve so we're looking for buy areas
[11:05:16] <guy> Buys AB @ 612
[11:06:09] <tuna> me too
[11:07:23] <guy> can someone tell me what oil is doing - i've lost my oil chart
[11:07:34] <tuna> 51.35
[11:07:49] <tuna> 51.27
[11:08:21] <guy> thanks
[11:08:36] <fspeculator> +0.64%
[11:08:42] <fspeculator> on top of yesterday's +3.3%
[11:08:55] <guy> thanks fspec
[11:09:00] <guy> here is my trade
[11:09:01] <guy2>

[11:09:07] <guy> it was 90% alpha instigated
[11:09:25] <guy> and 10% was off the high (all sessions) from yest.
[11:10:08] <guy> exit stop set AB @ 611
[11:10:29] <guy> still very much in the embryo stage so we haven't made anything on it yet and could still lose 1 point
[11:10:52] <guy> good news is that alpha continues to support the trade:
[11:10:53] <tuna> it was single instigated here
[11:10:55] <guy2>

[11:11:07] <tuna> oh goody
[11:12:08] <tuna> plus vwap
[11:12:38] <tuna> vwap was real close to there too i should add
[11:13:56] <guy> vwap is volume weighted average price right?
[11:14:39] <fspeculator> y
[11:14:49] <fspeculator> volume poc so to say
[11:15:11] <tuna> well said fspec
[11:15:32] <guy> okay
[11:15:44] <guy> how do you identify it tuna? using the MP chart?
[11:15:51] <guy> that long is also a single print long btw
[11:15:56] <tuna> wish esig had it
[11:16:09] <tuna> right
[11:16:30] <tuna> that was my entry
[11:16:41] <tuna> that and vwap
[11:17:06] <fspeculator> vwap 96.75?
[11:17:20] <tuna> 612's
[11:17:25] <guy> so what do you use? chart/software to identify VWAP?
[11:17:39] <tuna> qt
[11:17:59] <guy> k
[11:18:00] <fspeculator> i'm a bit weary about these things
[11:18:08] <fspeculator> in 7pt ES ranges (let alone4pt)
[11:18:17] <tuna> fabulos charts amost free
[11:18:18] <fspeculator> every tick has a "meaning"
[11:18:34] <guy> the single print strategy has another winner today
[11:18:39] <fspeculator> tuna you use it with IB and backfill?
[11:18:47] <tuna> no
[11:18:57] <tuna> iqfeed
[11:19:15] <tuna> 1 off at 13
[11:20:06] <guy> [11:09:07] <guy> it was 90% alpha instigated
[11:20:06] <guy> [11:09:25] <guy> and 10% was off the high (all sessions) from yest.
[11:20:28] <guy> Had I noticed at the time that there was a single there I would have had even MORE conviction on that trade
[11:20:45] <tuna> lol
[11:20:53] <tuna> jeez guy
[11:21:02] <guy> I'm going to have to modify the DVATool to put in confirmed and unconfirmed singles for me
[11:21:16] <guy> so I don't miss stuff like that
[11:21:40] <tuna> those little things
[11:22:01] <fspeculator> guy you mean unconf singles for today's trade?
[11:22:28] <guy> correct fspec: so once a single is created but not confirmed a line is drawn in
[11:22:35] <guy> and if we trade through it then it's removed
[11:22:51] <guy> and the unconfirmed line will be a different style/color
[11:22:58] <guy> so we know that it's not a confirmed single
[11:23:28] <guy> and then once confirmed changed to the standard singles color
[11:28:12] <tuna> sounds like a plan
[11:30:15] <tuna> another one off here
[11:30:27] <guy> nice tuna
[11:30:32] <guy2>

[11:30:36] <tuna> tanks guy
[11:36:12] <tuna> chicago
[11:36:55] <guy> k
[11:41:31] <guy> okay my thinking here and now:
[11:41:40] <guy2>

[11:41:46] <guy> i am thinking that we can get RE to the upside
[11:42:00] <guy> so i'm looking to hold this long until at least RE and beyond
[11:42:14] <tuna> k
[11:42:25] <guy> if we hit RE extension I will look at 2 things:
[11:42:46] <guy> 1. If RE is a spike over the IB and no new business
[11:42:48] <guy> and
[11:42:56] <guy> 2. alpha not showing buying signs
[11:43:01] <guy> then i'll probably get out
[11:43:33] <guy> if, however, there is good follow through in both buying at and beyond RE indicating new business there and alpha shows follow through
[11:43:51] <guy> then I'll try and sit on it for the rest of the day hoping for it to turn into a trend day up
[11:44:05] <guy> but as i've been typing that the market is going against this trade
[11:44:25] <tuna> hmmm we have oops had a ledge
[11:44:28] <guy2>

[11:46:06] <tuna> another trip back to the vwap
[11:47:31] <tuna> prolly wont hold
[11:47:35] <tuna> imo
[11:47:54] <tuna> but i hope im wrong
[11:49:47] <guy> hard to tell but alpha seems green and happy so i will play out the odds
[11:50:31] <tuna> yeah im still in too with last 1
[11:52:16] <tuna> 89 ema at 11 on a 3min chart fwiw
[11:53:21] <guy> i've got my oil chart back and i can see the problem
[11:53:42] <guy> oil is going up and that's what is puting the dampener on the equities
[11:55:50] <tuna> was some sort of news about the bigs saying they're not gonna drill/develope new fields or something like that
[11:56:42] <guy> which should push the price down not up...
[11:57:05] <tuna> yeah,,one would think so
[11:58:59] <fspeculator> guy have you run some correlation analysis of oil-vs-stocks?
[11:59:18] <guy> yes
[11:59:31] <fspeculator> what was the result? and what timeframe please
[11:59:49] <fspeculator> and how? was it up-up, up-down etc?
[12:00:09] <fspeculator> or you take the magnitude of the move into account?
[12:00:23] <fspeculator> bec all i see is that oil is advancing up along equities
[12:00:30] <guy2>

[12:00:32] <fspeculator> and also bonds are advancing along equities
[12:01:04] <mashhad> Guy, would you say that ES is showing a little weakness on the long side since alpha went - for a few mins?
[12:01:26] <guy> Oil and E-mini S&P500
[12:01:30] <guy> that link fspec
[12:02:20] <guy> mash: here is the ES chart:
[12:02:26] <guy2>

[12:02:28] <guy> and yes, I agree with your comment
[12:02:54] <guy> especially when compared to ER2 chart:
[12:03:01] <mashhad> ok
[12:03:03] <guy> where alpha is showing far more strength on the ER2
[12:03:04] <guy2>

[12:09:15] <fspeculator> guy your alpha is mkt specific?
[12:09:21] <fspeculator> ie different for ES than ER?
[12:12:19] <guy> no - same formula
[12:13:51] <tuna> time to water the flowers bbiab
[12:14:16] <guy> k
[12:16:18] <fspeculator> guy i've read your piece on oil
[12:16:42] <fspeculator> i think if you do an analysis over a long period of 6-12mo or more
[12:17:03] <fspeculator> that last few years oil has had very little NEGATIVE impact on stocks
[12:17:22] <fspeculator> you may even find that it "boosted" stocks (positive correl)
[12:17:37] <fspeculator> as both oil and stocks had huge run-ups since 2003
[12:17:47] <fspeculator> my opinion is that the reason is inflation
[12:18:10] <guy> fspec - i think that i noticed most of the -ve correlation at oil extremes
[12:18:23] <fspeculator> increasing price in stocks, real-estate, oil, gold etc
[12:19:21] <fspeculator> as paper money becomes more abundant, EVERYTHING goes higher in price
[12:19:40] <fspeculator> everything of some scarcity
[12:29:30] <tuna> hmmm
[12:30:12] <tuna> shoulda changed the oil too
[12:30:39] <guy> :)
[12:30:53] <guy> here come the split counts
[12:31:00] <guy2>

[12:31:35] <guy> the one that i'm long is showing the worst split count
[12:31:50] <tuna> i noticed
[12:32:17] <tuna> sox are very strong
[12:32:34] <tuna> above my weekly r1
[12:53:28] <guy> exit stop moved to breakeven AB @ 612
[13:00:36] <guy2>

[13:02:09] <fspeculator> guy you really caught the bottom tick this time? :-)
[13:02:31] <guy> i did - so did the 'single print' strategy
[13:03:06] <guy> but could still breakeven if I get stopped
[13:04:03] <tuna> does it count if you didnt see the single?
[13:04:38] <guy> yes - the forward testing single counts because you can do the figures after the day is over
[13:04:42] <guy> it's a mechanical system
[13:04:53] <guy> and i'm testing it and not trading it
[13:05:04] <tuna> oh
[13:05:05] <guy> it is just coincidence that i'm long
[13:05:10] <guy> at the same point
[13:05:25] <tuna> yes
[13:05:26] <guy> i hadn't noticed that the forward testing system was also long
[13:06:16] <guy> i'm trying to work on the algorithm now to get the unconfirmed singles to print on the chart - boy it's complicated
[13:07:16] <tuna> see if you can come up with a vwap that plots like a ma
[13:07:45] <guy> i think i've tried that before but i don't think that esignal gives me the volume info that i need
[13:07:57] <tuna> ahh
[13:08:00] <tuna> ok
[13:08:08] <mashhad> Guy, how about VAh/l and POC?
[13:08:23] <guy> DVATool plots those mash
[13:08:26] <guy> it's an option
[13:08:44] <mashhad> oh,ok.. because i didn't see them on your charts
[13:09:48] <guy> Have a look at this chart mash:
[13:09:53] <guy2>

[13:10:14] <guy> from the bottom, the solid lines, green, blue, red
[13:10:21] <guy> are VAL, POC, VAH
[13:10:33] <guy> and those are put there by DVATool
[13:10:48] <guy> and then higher up the lime, cyan and pink lines are the
[13:10:57] <guy> DVAL, DPOC, and DVAH
[13:11:06] <guy> also put there by DVATool
[13:12:06] <guy> all the colors and styles can be changed
[13:12:13] <mashhad> so 608.30 which is the VAH, is that the gray line?
[13:14:08] <guy> no, the solid red line at 608.7 is the VAH
[13:14:21] <guy> different to esignal's which is 608.3
[13:15:02] <mashhad> you mean it calculates on it's own?
[13:15:05] <guy> i'm still working on the formula and not 100% convinced that esignal is correct here
[13:15:23] <guy> but i'm planning on adding an option to replicate esignal if that's what we want to do
[13:15:31] <guy> yes it calculates it mash
[13:15:42] <guy> from the previous day's data
[13:15:50] <mashhad> i see..
[13:16:05] <guy> the grey dotted line is the IBL
[13:17:23] <guy> another useful feature of the DVATool is the Graphic button
[13:17:38] <guy> On this ES chart:
[13:17:49] <guy2>

[13:17:49] <guy> see the Graphic button in the bottom left hand corner?
[13:18:11] <guy> Well if you click it you get this graphic:
[13:18:16] <guy2>

[13:18:35] <guy> which allows you to quickly view an MP graphic off any line chart without having to bring up a seperate MP chart
[13:19:23] <mashhad> but these VA's are different from E-signal
[13:20:17] <mashhad> right now es-gnals's val is 6.75 and your is 5.75
[13:21:19] <guy> i've got 6.25 on esig
[13:21:46] <guy> and 5.75 on mine
[13:21:51] <mashhad> now, but when u posted it was 6.75.. in anycase, 6.25 is 0.5 diff too
[13:22:30] <guy> true
[13:22:52] <guy> i'm looking into the difference
[13:22:59] <guy> i'll see if i can resolve it
[13:23:16] <mashhad> well, u never know though, yours might be more accurte
[13:24:21] <mashhad> got to observe it for a while .. it's difficult on Dvas but on VA's it could always be looked at for the opening trades to see which one gives a better signal, yours or e-signals
[13:24:24] <guy> well mine is according to the Dalton book
[13:24:36] <guy> and the esignal one according to the steidlmeyer book
[13:24:45] <guy> and it is an "area"
[13:24:54] <guy> which I use alpha with
[13:25:01] <guy> so it doesn't affect my profits
[13:25:12] <guy> but I can see how other people would prefer it to be to the tick
[13:28:36] <guy> Here is a chart showing the new TimingA1 tool
[13:28:48] <guy2>

[13:28:59] <guy> Sorry TimerA1
[13:29:29] <guy> you can see the parameters that I've set: 20, 800, -400
[13:29:54] <guy> and it put 2 green buy blobs around 11:40
[13:30:10] <guy> and has just now put 3 green buy blobs at this recent low
[13:30:24] <guy> current RF:
[13:30:32] <guy2>

[13:31:41] <guy> bbiab - hard stop in place
[13:38:45] <tuna> that was just anoyher trip to the vwap on er2
[13:38:53] <tuna> another
[13:51:39] <guy> Exited all Long AB at 613 --> + 1
[13:52:04] <guy2>

[13:52:09] <tuna> vn
[13:52:12] <guy> support from alpha is no longer with us
[13:52:21] <guy> so i've decided to abandon this trade here
[13:53:40] <guy> thx tuna
[13:55:24] <tuna> i still have the 1 long
[13:55:54] <tuna> almost added near dval
[13:56:06] <mashhad> i am looking at a place to short on ES
[13:59:30] <guy> here is the ES chart:
[13:59:36] <guy> why do you want to short mash?
[13:59:37] <guy2>

[13:59:43] <guy> we've just had an alpha buy
[14:00:06] <guy> are you looking to short the DVAH?
[14:00:17] <mashhad> yes
[14:00:23] <guy> RF's for ES are 0:
[14:00:29] <guy2>

[14:00:54] <guy> I have DVAH at 98.75 = what does esig MP have?
[14:01:04] <mashhad> same
[14:01:36] <mashhad> i am working 8.50 at the moment
[14:02:28] <guy> good strategy, 99.00 is HOD and that's 2 ticks below that and 1 tick below IBH
[14:02:46] <mashhad> and if i get filled, i am only risking 4 ticks
[14:02:58] <guy> the only thing that I would watch in your position is the value of alpha when you get filled
[14:03:11] <mashhad> exactly
[14:03:29] <tuna> keep in mind spoos has re up
[14:03:33] <tuna> fwiw
[14:03:45] <guy> how many ticks RE in SP?
[14:03:51] <tuna> 4
[14:04:13] <mashhad> was that in the f bracket?
[14:04:20] <tuna> just thought id pass it along
[14:04:28] <tuna> yes sir
[14:04:33] <mashhad> ok
[14:05:06] <fspeculator> just 4 ticks in RE?
[14:05:08] <fspeculator> in SP?
[14:05:20] <mashhad> now e-signal dvah dropped to 8.25..yours?
[14:05:45] <guy> no still at 8.75
[14:06:12] <tuna> 8.25 here
[14:06:15] <tuna> too
[14:07:06] <guy> you got MP on QT tuna?
[14:07:16] <tuna> spoos doesnt have that bottom ledge like es does
[14:08:23] <tuna> but it has a top one
[14:09:53] <tuna> no guy qt doesnt have mp
[14:11:37] <tuna> spoos chart isnt nearly as ugly as es imho
[14:12:40] <guy> how do you see the MP chart tuna?
[14:13:56] <tuna> it just doesnt have that bottom ledge on the 'p' like the es does,,also re up unlike es
[14:17:40] <mashhad> it doesn't look like alpha is gonna give a strong sell signal at 8.50
[14:18:12] <mashhad> moved order to 8.75
[14:18:45] <guy> here's your chart mash:
[14:18:50] <guy> you should see the same on yours
[14:18:56] <guy2>

[14:19:07] <guy> so i have both IBH and DVAH
[14:19:12] <guy> at same 98.75
[14:19:21] <guy> and alpha at around -.5
[14:25:34] <tuna> guy,new paltalk will try to auto start on your start up fwiw
[14:26:22] <tuna> tries to load a trojan too
[14:26:52] <tuna> pm's sit in the tray now
[14:27:34] <guy> thanks tuna
[14:28:01] <guy> what cleans out the trojan? adaware? pest patrol?
[14:28:12] <mashhad> s 98.75
[14:28:20] <guy> good trade mash
[14:28:27] <mashhad> hard stop 00.25
[14:28:34] <tuna> nod32
[14:28:43] <guy2>

[14:28:47] <tuna> i use nod32 beta
[14:28:50] <guy> there's your chart mash
[14:28:56] <guy> good luck
[14:29:10] <mashhad> thanks
[14:29:15] <guy> you've got alpha + DVAH + IBH + HOD all on your side
[14:29:25] <guy> i have to step away now but will be back...
[14:29:36] <tuna> spoos single ticked
[14:29:44] <tuna> fwiw
[14:31:18] <mashhad> what do u show for ur dval?
[14:31:43] <tuna> er2 is trying my patience again
[14:32:03] <tuna> me?
[14:32:29] <mashhad> no guy
[14:37:32] <guy> my DVAL is 1196.25 now
[14:37:47] <guy> here is a chart
[14:37:51] <guy> DVAL is the lime line
[14:37:53] <tuna> oil closed red btw
[14:37:57] <guy2>

[14:38:09] <guy> you can see that it dipped to 96.00 but it's back at 96.25 now
[14:38:38] <mashhad> so urs is 6.25 vs. esig 6.75
[14:38:49] <guy> yes
[14:39:01] <guy> very nice trade btw
[14:39:06] <guy> thanks for the oil update tuan
[14:39:07] <mashhad> btw, your dvah was more accurate since we hit 99
[14:39:08] <guy> tuna
[14:39:16] <guy> bbiab
[14:39:17] <mashhad> +2 on 1st contract! :)
[14:39:27] <guy> excellent !! :)
[14:39:49] <mashhad> setting my stop at 99.25 against any range extension
[14:42:49] <tuna> nice mash
[14:43:56] <mashhad> thanks
[15:00:36] <guy2>

[15:31:43] <guy2>

[15:35:25] <mashhad> out -0.50
[15:35:58] <guy> you made money though
[15:36:05] <guy> good hold there
[15:36:06] <tuna> lol guy
[15:36:08] <mashhad> yes,
[15:36:22] <mashhad> made 1.5+
[15:36:43] <mashhad> i actually got to run, see you tomorrow
[15:36:45] <tuna> nice mash
[15:37:16] <tuna> guy i still have the last 1
[15:37:33] <guy> excellent tuna!
[15:37:49] <tuna> what a test
[15:37:59] <guy> very good hold there
[15:38:13] <tuna> was NOT easy
[15:41:47] <tuna> but it was a free trade,, so not too bad
[15:42:26] <guy> true
[15:50:15] <tuna> seems like singles that match up with the vwap work pretty well
[16:00:50] <guy2>

[16:01:35] <guy> This is interesting:
[16:01:40] <guy2>

[16:01:46] <guy> alpha on ES is showing a buy signal
[16:01:54] <guy> and on ER2 a sell signal
[16:02:04] <guy> don't know if i've ever seen that together before
[16:02:12] <tuna> thx guy
[16:02:30] <guy2>

[16:02:33] <guy> y/w tuna
[16:02:49] <guy> still long tuna?
[16:03:18] <tuna> no
[16:03:47] <guy> good trading - you must have taken about 3 points on that last contract
[16:04:53] <tuna> yep last 1 was woth the wait
[16:04:59] <tuna> worth
[16:05:02] <guy> excellent :)
[16:05:13] <guy> i like it when people make points :)
[16:05:39] <tuna> was that or go change the oil
[16:05:55] <guy> finished watering the garden then?
[16:06:02] <tuna> yes
[16:06:21] <guy> changing the oil on your car?
[16:06:28] <tuna> right
[16:07:01] <guy> messy job - but has to be done
[16:07:13] <tuna> i have all weekend to do that tho
[16:07:56] <guy> not going away for w/e then?
[16:08:10] <tuna> nahh
[16:08:45] <tuna> cant afford the gas ;)
[16:08:53] <guy> :)
[16:09:07] <guy> It looks like the single print strategy is going to close its last contract at the last traded price
[16:09:24] <guy> I've just had to add another rule to the strategy that says that it doesn't carry overnight
[16:09:36] <guy> and that any open contracts close at the last traded price
[16:10:15] <tuna> im too chicken to hold overnite
[16:10:38] <guy> best not to unless you've got a good buffer and good reason
[16:11:28] <tuna> mebbe shorts are ok,,but still, anything can happen
[16:15:59] <guy> I'll update the singles shortly:
[16:16:19] <tuna> thx again guy
[16:17:35] <guy> y/w tuna
[16:24:52] <guy> Single print strategy made $870 today and cumulative for month is $2,150
[16:25:27] <guy> gn all
[16:26:25] * Disconnected
Session Close: Thu May 26 16:26:28 2005
Emini Day Trading /
Daily Notes /
Forecast /
Economic Events /
Search /
Terms and Conditions /
Disclaimer /
Books /
Online Books /
Site Map /
Contact /
Privacy Policy /
Links /
About /
Day Trading Forum /
Investment Calculators /
Pivot Point Calculator /
Market Profile Generator /
Fibonacci Calculator /
Mailing List /
Advertise Here /
Articles /
Financial Terms /
Brokers /
Software /
Holidays /
Stock Split Calendar /
Mortgage Calculator /
Donate
Copyright © 2004-2023, MyPivots. All rights reserved.
Copyright © 2004-2023, MyPivots. All rights reserved.