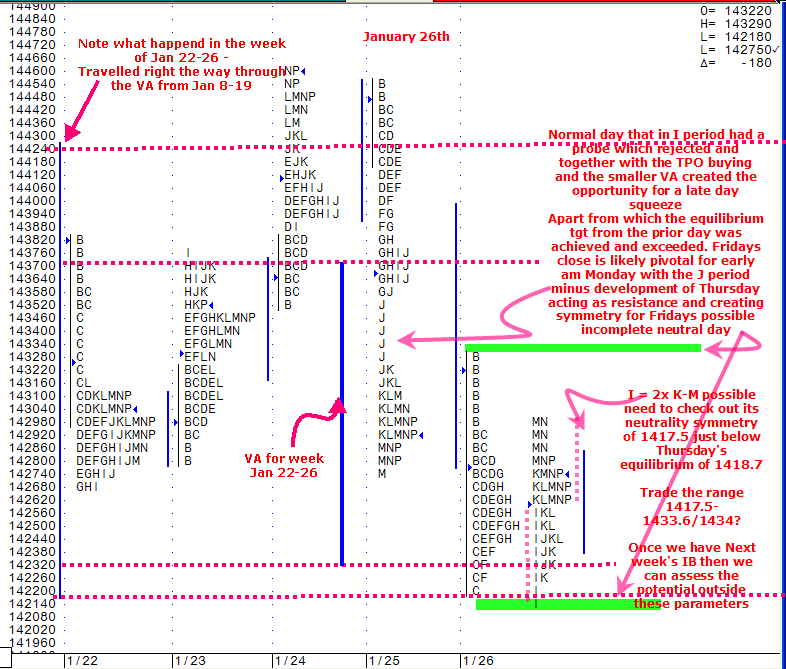
S&P Jan 26th
Alley, I've just noticed that you are placing some emphasis on weekly and double-weekly (e.g. Jan 8 - 19) value areas. I do not recall you working with these value areas as much in the past as you are doing now but that could just be a lack of observation.
So my questions: Are you using weekly value areas more of late, or the same that you have been in the past? When measuring a weekly value area, do you use the calendar weekly or a trailing/rolling number of days in the past? (e.g. last 5 trading days). If calendar, then the follow up question would be: Have you ever looked at the value area of the previous 5 (or N) trading days for areas of support or resistance?
So my questions: Are you using weekly value areas more of late, or the same that you have been in the past? When measuring a weekly value area, do you use the calendar weekly or a trailing/rolling number of days in the past? (e.g. last 5 trading days). If calendar, then the follow up question would be: Have you ever looked at the value area of the previous 5 (or N) trading days for areas of support or resistance?
Daytrader you only see here a very small part of the real work that I do on MP. Since 1987 I have been using MP in the yearly, quarterly, monthly, weekly, daily and intra-day timeframes. The concept of using say a 5 day 20 day 50 day rolling profile was something that Don Jones advocated with his meta-profiles but the reality is that there is no hard and fast rule. Distributions start when another has ended. One looks for obvious reference points . within the 4 steps of market activity there are a further approximate 8 steps available. I calculate not just multiple timeframe VA but also track the activity of the dominant trader frequently referred to as the CTi2. To an answer your question more precisely: using more: No . Using the same: yes weekly va measure: calendar weekly and trailing. it s a case of the distribution telling me when to split and start something new.
Thanks Alley!
Emini Day Trading /
Daily Notes /
Forecast /
Economic Events /
Search /
Terms and Conditions /
Disclaimer /
Books /
Online Books /
Site Map /
Contact /
Privacy Policy /
Links /
About /
Day Trading Forum /
Investment Calculators /
Pivot Point Calculator /
Market Profile Generator /
Fibonacci Calculator /
Mailing List /
Advertise Here /
Articles /
Financial Terms /
Brokers /
Software /
Holidays /
Stock Split Calendar /
Mortgage Calculator /
Donate
Copyright © 2004-2023, MyPivots. All rights reserved.
Copyright © 2004-2023, MyPivots. All rights reserved.
