A pitbull setup
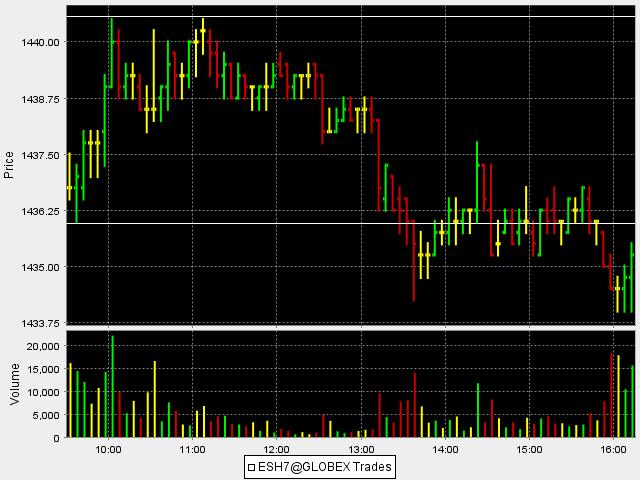
At the request from Max I thought I'd post a little beauty of a setup that I use....It's probably bastardized from somewhere so I won't take complete credit by any means. It is based on a Market divergence between the emini Dow and the emini S&P when they are trading near the extremes of the day ( the highs or the lows) . I will post some basic charts from a demo account ( which sucks because I don't know how to get text on the chart itself) but I won't give away all my secrets..lol...I have traded this method for a long time and some are improving it which is great ... we can also get ideas from some of the great minds on this forum...a few things first 1)I synch the emini dow to start at the same time as the emini S&P...for me that is 9:30 Eastern..I donot display any other earlier dow data....2) I look for the dow to make a new high ( in this example) but not the S&P...then I look to fade...so I will take a short 3) I fade moves and do not play breakouts so in general I sell strength and buy declines..now this may seem too simplistic for most but it is very powerful...The first chart is the emini S&P..Notice the retest of the 10:05 high at 11:10 on lower volume....at this time the Dow actually made a higher high.( see the dow chart)..then the dow again made a higher high at 12:05 too…but look what was happening to the S&P…again not near it;s highs..look at the volume ( or lack of)on the retests..This isn’t a perfect example but it worked for me…...To back test this, the only suggestion I can make is to watch it for a while....
Now look what happens when the S&P is making new lows on the day but not the Dow...so the setups work in reverse too and can be used as a way to take profits... I have drawn trendlines...these entires can be improved by adding the $Tick index ( hint - Max) or something that works for the individual trader...some like to see what the Nasdaq composite is doing..you can even add an indicator.. .There is a way to utilize this method while we are inside the days range but that will be for another post. Hope somebody can understand this simple yet effective setup. And if I ever become a vendor ( which I won't ) I'll supply you with 7 years of statements or more...lol..
Now look what happens when the S&P is making new lows on the day but not the Dow...so the setups work in reverse too and can be used as a way to take profits... I have drawn trendlines...these entires can be improved by adding the $Tick index ( hint - Max) or something that works for the individual trader...some like to see what the Nasdaq composite is doing..you can even add an indicator.. .There is a way to utilize this method while we are inside the days range but that will be for another post. Hope somebody can understand this simple yet effective setup. And if I ever become a vendor ( which I won't ) I'll supply you with 7 years of statements or more...lol..
<< reply moved to the Pitbull Part II thread >>
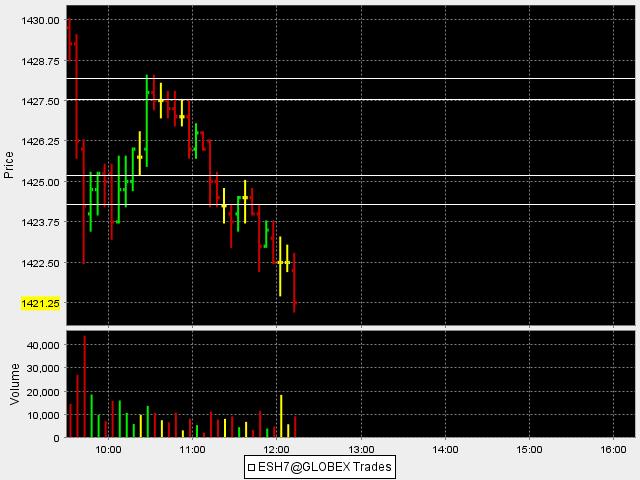
here is a five minute bar chart...can anyone spot the attempted breakdown at the 10 a.m bar on low volume which set up the signal to get long...a mini 1-2-3 pattern.....look what the ticks where doing then too....look how high the Ticks got on the push up into that top zone in the 1427.50 - 1428 area....at 10 am the dow was making new lows ( see pitbull set up number 1 ) but not the SP..for the market divergence trade...If anyone need me to post the Tick or dow chart I will later..Wife has last minute X-mas plans for me...lol
see how we can incorporate both concepts to set up a winning trade..?
Hope someone is getting something from this.....my demo account charts kinda sucka bit but it would be too much work for me to clean up my other charts for this demonstration..anyway....lets seee if this current break down.....I have intentinally left one spot unmarked which occurred in the first 7 minutes of trade to see if anyone can spot it...it's like a quiz
I agreee that the dow might be a better candidate because we are talking about only 30 stocks trying to out-muscle the other indexes which obviously have many more issues in their make up.....but it really doen't seem to matter which one you take the trade in...I like taking the trades in the es because it's my favorite....but they both move when the trade works in the direction that we have intended...adding more indexes can certainly help but I get confused when I watch too much stuff...my simple mind can't handle it all..lol...I think incorporating the Naz composite is a good one to keep up but the ones you mention can help too....For this particular setup I'm trying to keep it simple ( for now) just to show it's effectiveness...I just posted a trade on my other pitbull thread which probably should have been posted here...but the concepts are intertwined . there was a nice divergent trade on the lows today...i can't comment too much on the Russel because I haven't got a handle as to how it specifically reacts or leads the other indexes...so any help there is appreciated..I beleive it was Raschke that I first saw using the Breadth along with the TICKs...perhaps PT_mini can zoom us in on that one...thanks for the feedback and please interject more of your thoughts/ideas..
quote:
Originally posted by pem06081971
Hey BruceM........SHHHHHHHHHH!
Watching intermarket relationships during the day is a very powerful cocept, have been doing this for a long time. I actually watch the ES, YM, NQ, and the AB, however about 80 percent of my trades are in the ES or the YM. I am not thrilled with the NQ's, although they trade better now that the tick size has been reduced. THe AB (russell) is a bit quirky sometimes in my opinion.
You can also watch the Tick and the Advance/Decline charts looking for these divergences.
Ehile today there was a nice long setup in the YM in the 10 AM range there are a few nuances with this to keep in mind.......
A lot of times these divergemce trades are better on the short side, seems to take a lot less to push the market down the pull it up.
The Dow is the best to fade it seems, it seems to get overextended and get whacked more often.
In the current enviornment shorting the Russell when it makes a higher high and nothing else does is dangerous, this may not be that way forever, but at the moment it seems to lead to the upside, the Russell making a new low when nothing else is is often fadeable to the long side.
<<reply moved to the Pitbull Part II thread>>
<<reply moved to the Pitbull Part II thread>>
<<reply moved to the Pitbull Part II thread>>
<< reply moved to the Pitbull Part II thread >>
Guy , Is there any way you can move my 9:11, 12:40,12:48 and 13:48 posts from today to the Pitbull Part II Thread? Also if you could move over Pt_emins 10:23 post from today that would help..Thanks..Then to give you more work you can delete this one if you have time...They all make more sense on that thread
Bruce
Bruce
<< reply moved to the Pitbull Part II thread >>
quote:
Originally posted by BruceM
Guy , Is there any way you can move my 9:11, 12:40,12:48 and 13:48 posts from today to the Pitbull Part II Thread? Also if you could move over Pt_emins 10:23 post from today that would help..Thanks..Then to give you more work you can delete this one if you have time...They all make more sense on that thread
Unfortunately that's not possible with this forum software. I wish it was. The best that you can do is just copy/paste from these topics into notepad and re-organize it and then post a new reply in the other thread. If you want to re-use the images then just click the Attach link and you will get a list of the images that you have already uploaded. Sorry I couldn't be more help.
Emini Day Trading /
Daily Notes /
Forecast /
Economic Events /
Search /
Terms and Conditions /
Disclaimer /
Books /
Online Books /
Site Map /
Contact /
Privacy Policy /
Links /
About /
Day Trading Forum /
Investment Calculators /
Pivot Point Calculator /
Market Profile Generator /
Fibonacci Calculator /
Mailing List /
Advertise Here /
Articles /
Financial Terms /
Brokers /
Software /
Holidays /
Stock Split Calendar /
Mortgage Calculator /
Donate
Copyright © 2004-2023, MyPivots. All rights reserved.
Copyright © 2004-2023, MyPivots. All rights reserved.


