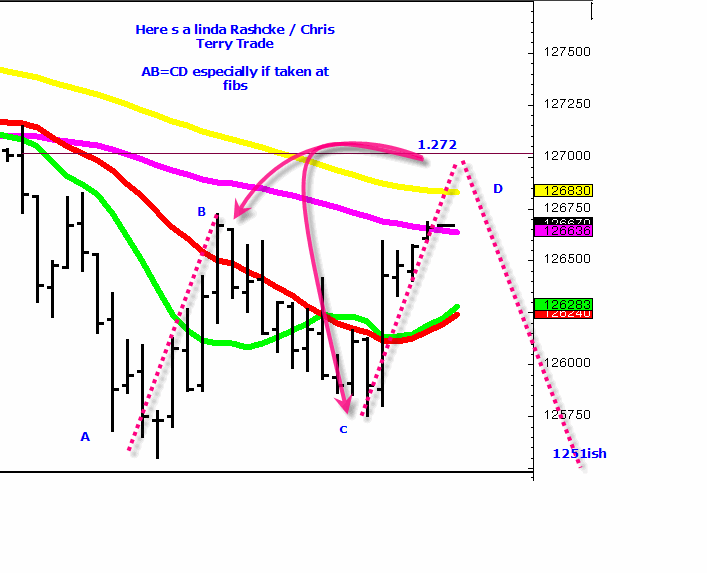
S&P Linda Raschke style
After a bit of messing around with my charts I managed to figure out that it's a 15 minute ES chart that you're showing right?
I understand the CD size versus AB size as a target resistance. What 2 numbers did you use to calculate the 1.272 fib resistance? I assume that this is cluster theory.
I understand the CD size versus AB size as a target resistance. What 2 numbers did you use to calculate the 1.272 fib resistance? I assume that this is cluster theory.
the range from c to d * 1.27.2 to give the projection. yes it was a 15 min chart however one could just as easily have used a 30 minute or hourly as well
Now I'm confused. The (vertical) range from a to b multiplied by 1.272 gives us the target from c to d?
In other words:
Abs(a - b) * 1.272 = Abs(c - d)
Because I thought that:
Abs(a - b) was supposed to = Abs(c -d)
...?
In other words:
Abs(a - b) * 1.272 = Abs(c - d)
Because I thought that:
Abs(a - b) was supposed to = Abs(c -d)
...?
my turn for the gremlins. the chart is correct the range from b to c * 1.272 ......
Ah okay - now I understand.
Is the ranbe between a and b supposed to equal the range between c and d also?
(I'm always impressed with LBR's articles - they have very sound logic behind them.)
Is the ranbe between a and b supposed to equal the range between c and d also?
(I'm always impressed with LBR's articles - they have very sound logic behind them.)
Emini Day Trading /
Daily Notes /
Forecast /
Economic Events /
Search /
Terms and Conditions /
Disclaimer /
Books /
Online Books /
Site Map /
Contact /
Privacy Policy /
Links /
About /
Day Trading Forum /
Investment Calculators /
Pivot Point Calculator /
Market Profile Generator /
Fibonacci Calculator /
Mailing List /
Advertise Here /
Articles /
Financial Terms /
Brokers /
Software /
Holidays /
Stock Split Calendar /
Mortgage Calculator /
Donate
Copyright © 2004-2023, MyPivots. All rights reserved.
Copyright © 2004-2023, MyPivots. All rights reserved.
