Chart times
The futures contracts trade also outside the regular trading hours (RTH).
Do you guys also look al these low volume hours or do you only look at the RTH?
I noticed that my indicators are messed up when I include the non RTH. But when I don't include them I have big gaps sometimes.
How do you handle this?
Do you guys also look al these low volume hours or do you only look at the RTH?
I noticed that my indicators are messed up when I include the non RTH. But when I don't include them I have big gaps sometimes.
How do you handle this?
The way that I've done it in the past is to specifically include and exclude the overnight data in my back tests and see which produce better results. Depending on the type of indicator that I use and the time frame I will or will not include that overnight information - if I'm looking at a time based chart.
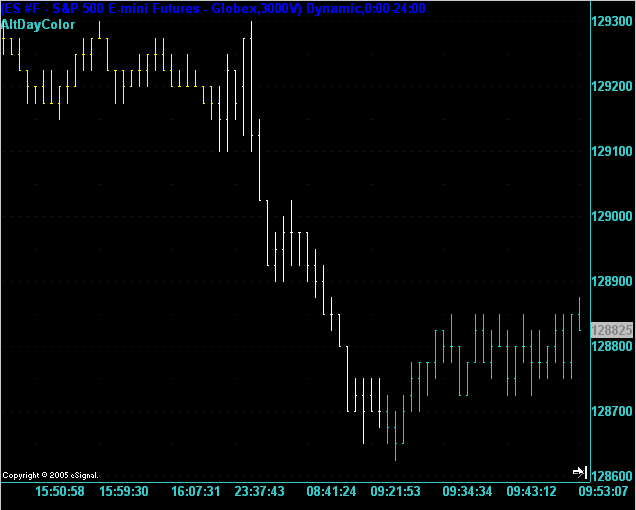
What I have found is that time based charts are not as good as volume (or tick) based charts. If you use a volume based chart then you will have 1 bar/candle for every X contracts which removes the "low volume" aspect of overnight and shows you market movement by activity instead of by time. I then also paint each day a different color and also paint the overnight a different color so I can see the effects of overnight versus RTH trading. There should be a chart somewhere on this forum which shows this. If you can't find it then let me know and I'll look for it.
Found it! Here it is:
Great reply!
I have looked into tick charts before but dismissed it for being not a lot different then time based charts. I seems I was wrong.
I'll papertrade with tick charts the next days/weeks. Let's see what it gives.
So you use tick charts all the time? What intervals do you use?
I have looked into tick charts before but dismissed it for being not a lot different then time based charts. I seems I was wrong.
I'll papertrade with tick charts the next days/weeks. Let's see what it gives.
So you use tick charts all the time? What intervals do you use?
I actually DO NOT use tick charts. I use only volume charts. (Well that's a lie because I have some indicators which by their very nature will only run on time based charts so I'm forced to use that.)
The reason that I use volume instead of tick based charts is because of certain limitations in tick charts and also the ability to manipulate tick charts. For example, the CME recently changed the way that it reports trades in that it now lumps together smaller trades at the same price and issues 1 tick when the price changes. This decreases the bandwidth the the CME uses but it makes it impossible for traders to compare a tick chart now to a tick chart before the CME made this change - which was a few (several?) months ago.
Read more here: Chart Types
Emini Day Trading /
Daily Notes /
Forecast /
Economic Events /
Search /
Terms and Conditions /
Disclaimer /
Books /
Online Books /
Site Map /
Contact /
Privacy Policy /
Links /
About /
Day Trading Forum /
Investment Calculators /
Pivot Point Calculator /
Market Profile Generator /
Fibonacci Calculator /
Mailing List /
Advertise Here /
Articles /
Financial Terms /
Brokers /
Software /
Holidays /
Stock Split Calendar /
Mortgage Calculator /
Donate
Copyright © 2004-2023, MyPivots. All rights reserved.
Copyright © 2004-2023, MyPivots. All rights reserved.
