Correlation between Oil and S&P500 futures
Oil is the news
As of writing this (21 August 2004), oil IS the news:
What we've noticed while trading the ES in the last couple of weeks is that the ES, on small timeframes, moves inversely to the movement in crude oil futures (symbol QM on eSignal). This prompted me to look at the relationship between oil futures and the ES in an attempt to discover if there's any correlation between the two. Unless noted otherwise all charts on this page show the daily closing price of the symbol/instrument mentioned.
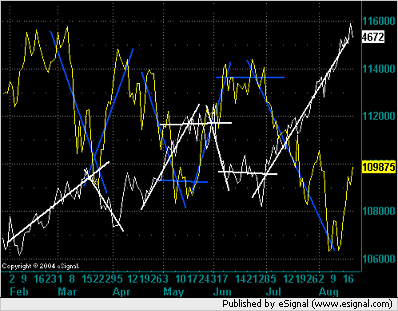
This is the first (messy) chart that I "scribbled" by hand in
order to show that oil and ES are negatively correlated. It's a
little bit misleading because it is roughly drawn and is not
accurate. Notice how in the last few days the ES has moved with oil
but I haven't shown that. The yellow line is the ES, the blue
straight lines are (hand drawn) best fit of movement of the ES, the
white lines are oil futures. This is a daily chart based on closing
prices.

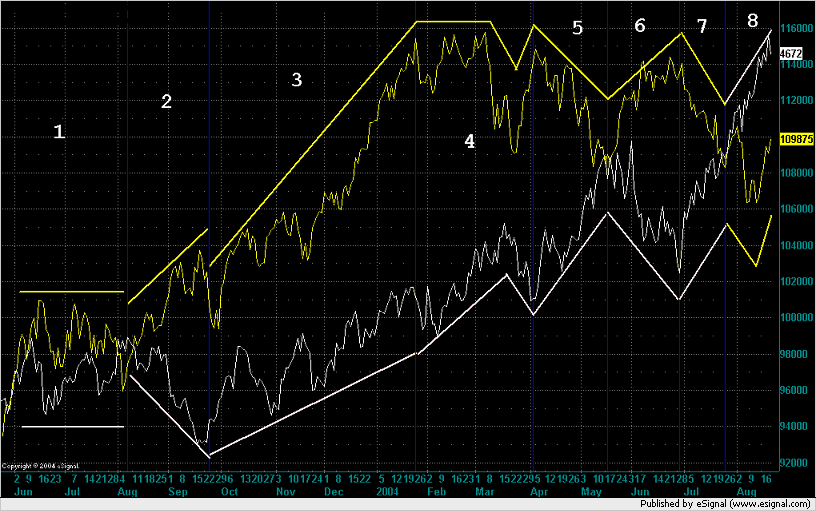
This chart is more accurate. Yellow is ES and white is QM (oil
futures). I have attempted to show in each numbered segment a
change in the correlation between the two. For example in segment 2
we see negative correlation as we do in segments 5, 6, and 7. In
segments 1 and 3 there's positive correlation and in segment 4
none.
What we are interested in here is what is happening now.
Segment 8 shows initial negative correlation which then becomes
positive correlation.

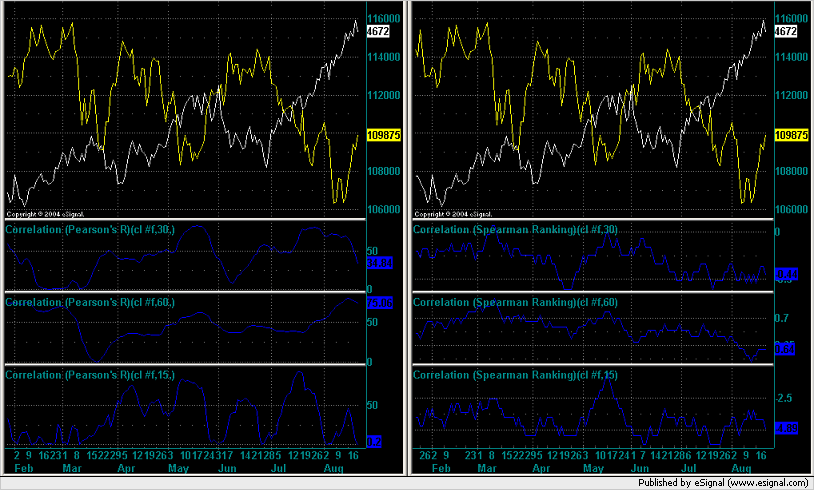
In an attempt to mathematically demonstrate a correlation
between the 2 futures I applied a couple of correlation studies to
them. The left hand chart shows the Pearson's R correlation and the
right hand chart shows the Spearman Ranking. The top panel shows a
30 day study and below that is a 60 and then a 15 day study.
To tell you the truth I could not make much sense from the
mathematical studies shown here so I've left this for the reader to
investigate further and let me know if there is something useful
and/or significant which can be used here. Formula details below...

The correlation formulae used in the above charts come from this eSignal group . If you wish to download these studies and use them with eSignal then I suggest that you go to that link and get them. The author of the studies may change or update them and those will be the latest.
Addendum (5 October 2004)
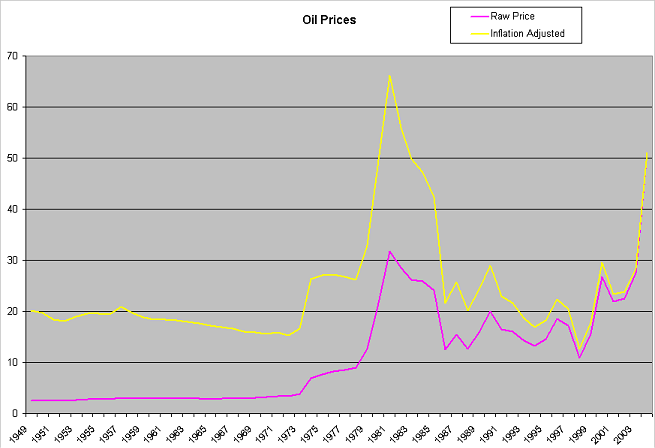
After a discussion with some fellow traders I decided to add this chart. This shows the inflation adjusted chart for oil from 1949 to present. We continue to make new highs in oil but we won't hit record levels until oil touches on $66.20. Technically oil looks like it is topping out on the charts and I agree with this statement but on many other levels the targets of $60 and then $66 also appear to be easily achievable. Because of the inverse relationship this appears to have on the ES it is crucial to watch oil while it is making new highs.

Final Note
I haven't proven this using any statistical method so this is just my observation. I have noticed over the last few weeks since oil became THE story that the equity indices can't move up while oil is rallying. When oil drops it freesthe equity indices to rally again.
There is a small amount of logic behind this phenomenon but not much. It's really (again this is my opinion) just a self fulfilling prophecy. If enough people believe it then by sheer volume of people acting in that manner they will move the markets as they expect it to: Oil up ES down and vice versa.
This can be compared to the release of a certain economic number in the market. A bad (for the market) number can have little impact or even cause a rally in a bull market just as the exact same number will have the opposite effect in a bear market. There's no logic to this because humans are trading the markets and not machines and as humans we don't claim to be logical. We are emotional and our buying and selling is spurred by greed and fear - but this isn't the place to talk about that.
Copyright © 2004-2023, MyPivots. All rights reserved.