Gap Fade June 2006
A losing month with the gap strategy
I write this article on 1 July 2006 which is midway between 2
months (June and July) which have each been profitable using the
June 2006 shows us a Raw Gap Fade strategy loss of 30.25 Emini S&P500 points. Now remember that the word raw in Raw Gap Fade means that this is just a benchmark against which to measure your own gap strategy and does not use stop losses. Not using stop losses is not recommended.
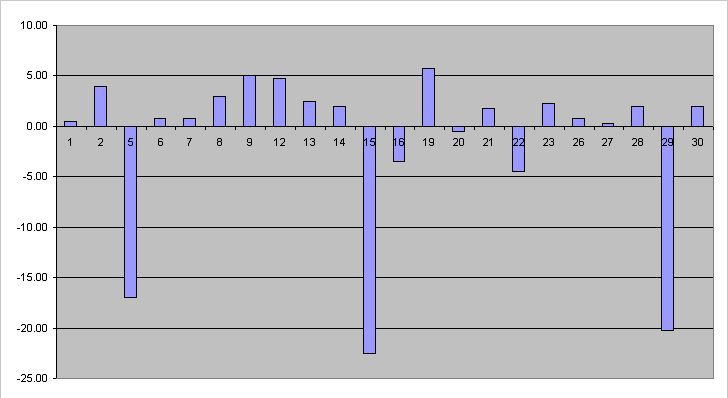
Let's take a look at the Profit/Loss profile over the month of June 2006.

We can see from the chart above that most of our losses came from 3 days. If the gap doesn't fill then we measure our loss from the opening price to the closing price.
Our three major losses when added together came to a total loss of just 1 tick shy of 60 points! That's a lot of loss for 3 trades. Looking at this chart you might think that using a 5 point stop could have solved all of your problems right?
It certainly looks logical. A 5 point stop loss would have taken those 3 big losers from 60 points of loss to 15 points adding 45 points back into your pocket and turning the 30 point losing month into a 15 point winning month. On the face of it, it certainly looks like it.
Max possible draw down
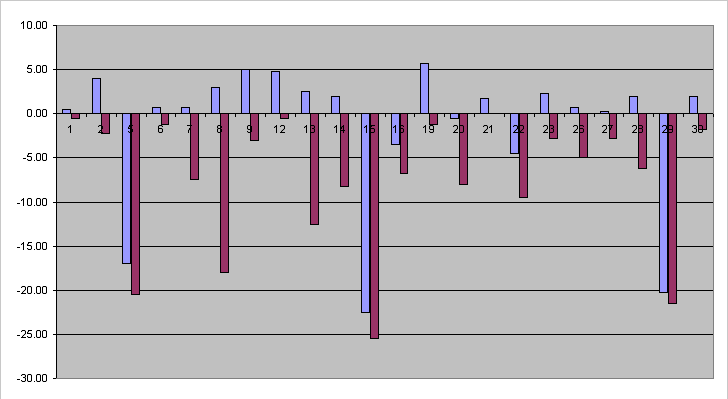
Now let's take a look at the next chart. What I have done here is to take the Profit/Loss chart from above and added in a Max Possible Draw Down bar - colored maroon.
I state that this is a possible draw down because I am working with daily Open High Low Close (OHLC) data at the moment and using this data we cannot tell if the target was hit before or after the draw down was experienced. Although I have access to lower time frame data I am not going to use it now because a lot of you reading this article do not have access to anything finer than daily data and I want to make this sort of research (the ability for you to continue the research) accessible to everyone.
The maroon bar shows the most adverse movement against our trade during the day. (Remember that this move may have come after our trade was closed out - but we don't know that.)
If we assume the worst case scenario, that each adverse move happened before the target was hit, then you will see that our suggestion of using a 5 point stop above, was in fact not such a great one. There are now 6 days which closed profitable in the month but would have been stopped out at a 5 point loss because of the use of a 5 point stop loss rule. Not only does that add 30 points of loss to the strategy but also removes the amount of profit that is currently sitting in our benchmark strategy for those days.

To stop or not?
There is a question about using stops at all. Should you use a stop loss rule and if so what should it be?
If you decide not to use a stop then what happens? This one is easy to answer. You are not really not using a stop. When your account hits its loss limit your broker will close out your positions and ask you for more money. Your stop is the size of your account. So in effect you do have a stop but it's very big.
Using stops is safer. However, what stop should you use? Too tight and it takes you out of a trade that could have been profitable. Too wide and your stops quickly add up to a losing strategy.
Unfortunately I am unable to answer this question in the Gap Fade strategy for the Emini S&P500 contract - yet. I have tested this strategy a number of times and have never managed to find an optimal stop. My back testing, however, used mathematical types of stops. For example, I tested stops that were a multiple of the gap, fixed size stops, percentages of overnight moves, etc. Nothing that I tested improved the results and made this strategy more accessible to the average trader by limiting the size of loss on any single trade.
I am of the opinion that the type and/or size of stop and the decision to use a stop should be based on a number of factors that are currently very difficult to test with this strategy. Those factors are (1) anticipated day type from early market action, (2) overnight market action as a clue to day type, (3) market backdrop (volatility and ranges).
Copyright © 2004-2023, MyPivots. All rights reserved.