Following the Rules
Easier said than done
Every trader should have a set of trading rules that they try to follow. You will find sets of trading rules all over the internet. A quick search using Google turned up the following links:- Douglas Zalesky's 25 Point Mantra (link no longer works so removed)
- The Global Futures Trading Rules
- Richard Rhodes' Trading Rules
- Trading Rules to Live By
Whatever rules you decide to use in your trading it is important that you:
- Write them down.
- Read over them before each trading session.
- Monitor your adherence to them by recording how you followed them when the trading session is over.
- Modify them if they become obsolete, market conditions change, your trading profile changes.
Does following my trading rules improve my performance?
I've created a spreadsheet (Trading Rules Review) that makes it easy for each trader to answer that question. Use this spreadsheet as a template and modify it for your own rules:
| Date | 1 | 2 | 3 | 4 | 5 | 6 | 7 | 8 | 9 | % | P/L | |
|---|---|---|---|---|---|---|---|---|---|---|---|---|
| 01 Jul 2004 | 1 | 1 | 1 | 1 | 1 | 1 | 1 | 1 | 0 | 89% | 10.00 | |
| 02 Jul 2004 | 1 | 1 | 1 | 0 | 1 | 1 | 1 | 0 | 1 | 78% | 8.57 | |
| 06 Jul 2004 | 1 | 1 | 1 | 1 | 0 | 1 | 1 | 1 | 1 | 89% | 2.00 | |
| ... | ||||||||||||
| 28 Jul 2004 | 1 | 1 | 0 | 1 | 1 | 1 | 1 | 1 | 0 | 78% | 7.14 | |
| 29 Jul 2004 | 1 | 1 | 0 | 0 | 0 | 1 | 0 | 1 | 0 | 44% | -3.00 | |
| 30 Jul 2004 | 1 | 1 | 1 | 0 | 1 | 1 | 1 | 1 | 1 | 89% | 8.57 |
Each rule is numbered in the first row of the spreadsheet. Each number has a comment attached to it which explains the rule so if you hang the cursor over that cell you can read the rule. To modify the rule, right click the cell and select modify comment. Delete/insert as many columns as appropriate to enter the rules that you follow.
The formula under the % column shows the percentage number of 1's versus total entries in that row (excluding the date column). Simply enter a 1 if you followed the rule for every trade that day or a 0 if you didn't in the column under the rule number.
In the P/L column I've entered the number of ES points made during that day but you can enter a $ amount or any figure you want that records your performance at the end of the day.
Plotting the Results

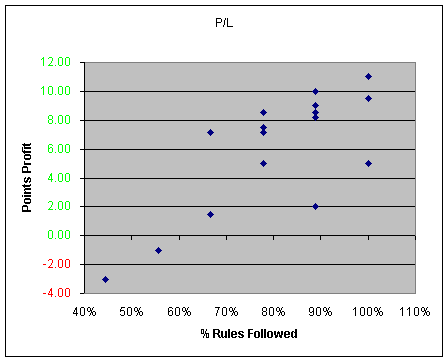
The chart that is linked to this table is an XY (scatter gram) chart that plots the percentage of rules that you followed versus your P&L for the day (you may need to adjust the source for the chart as you change the spreadsheet). In this sample spreadsheet it conveniently shows a direct positive relationship between results and rules followed. If you're not getting this relationship in your trading and you've filled in the spreadsheet accurately then you need to review your rules.
You don't have to wait for this week to finish to analyse your rule compliance versus performance. If you have enough information from your trade journal then go back and look at last week. The sooner that you're armed with this information the sooner you'll know what needs to be done to improve your trading performance.
The analysis doesn't stop there. You can add up each column of rules at the end of each week/month and see which rules you are struggling to follow. This will give you more insight into yourself and areas that you need to work on. Why can't you or won't you follow that rule? Do you need a lesson in discipline or does the rule need to be changed?
Copyright © 2004-2023, MyPivots. All rights reserved.